

Mariya Messerli left a thoughtful comment under my Kinsale Update (one of the best things about writing is having a community that actually digs into the details).
I want to use her question to write a short standalone post on prior‑year development (PYD) and what the loss triangles are really telling us.
In Part 4 of my Kinsale Deep Dive I explained the mechanics of loss development triangles in more detail. Most investors probably never go deep here — which is a pity, because it’s one of the few places where you can move from “story” to “evidence.” Rather than repeating the full explanation, I’ll point you to Chapter 5 in Part 4 (“Reserving quality: what the loss triangles tell us”).
Deep Dive - Kinsale Capital Group (Part 4)

In 5 articles, you’ll get a deep dive of Kinsale Capital Group (~100 pages).
Here’s just a quick refresher:
Insurers use prior‑year development (PYD) as a reality check on reserving. PYD captures how the estimate of ultimate losses for prior accident years changes over time. Unlike an industrial company, an insurer doesn’t know its true “COGS” at the time it writes the business — the final cost of claims only becomes clear years later. Until then, reserves have to be updated continuously based on new information and historical loss and claims patterns.
If prior estimates are revised upward, reserves were too low (reserve strengthening / adverse development). If they’re revised downward, reserves were conservative (reserve releases / favorable development).
The key point: PYD is backward‑looking. It’s about claims that already happened — and how good the original assumptions were.
The main tool to analyze this is the loss development triangle. Accident years run vertically (the year the loss occurred), development years horizontally (how many years have passed since the accident year). Each cell shows a cumulative value as of a given evaluation date. Following the diagonal (the latest evaluation for each accident year) shows how the estimate for a given cohort changes from year to year. That is exactly what drives PYD.
The incurred claims triangle (shown above as an example) reflects economic losses (including loss adjustment expenses). It’s a best estimate of ultimate cost. That’s why the incurred triangle is the most direct window into reserving: it shows how the insurer re‑estimates ultimate losses for a cohort as new claims are reported, cases settle, court outcomes come in, and inflation and cost trends evolve.
The cumulative paid claims triangle, by contrast, shows cumulative claims payments (cash outflows) over time. It answers a different question: not “what do we think this will cost,” but “how much has actually been paid so far and how quickly.” The paid claims triangle makes the payout pattern visible.
A useful link between both triangles: the gap between incurred and paid is the outstanding reserve position for that accident‑year. Intuitively, incurred is today’s estimate of the final bill; paid is what’s already been paid; the difference is the remaining liability on the balance sheet. As an accident year matures, the two lines converge; once a year is “fully developed,” the gap becomes small/zero.
When talking about PYD, it also matters whether we look at one‑year PYD (vs. the prior year) or multi‑year PYD over the full life of an accident year.
In my last update I showed the following chart for one‑year PYD:
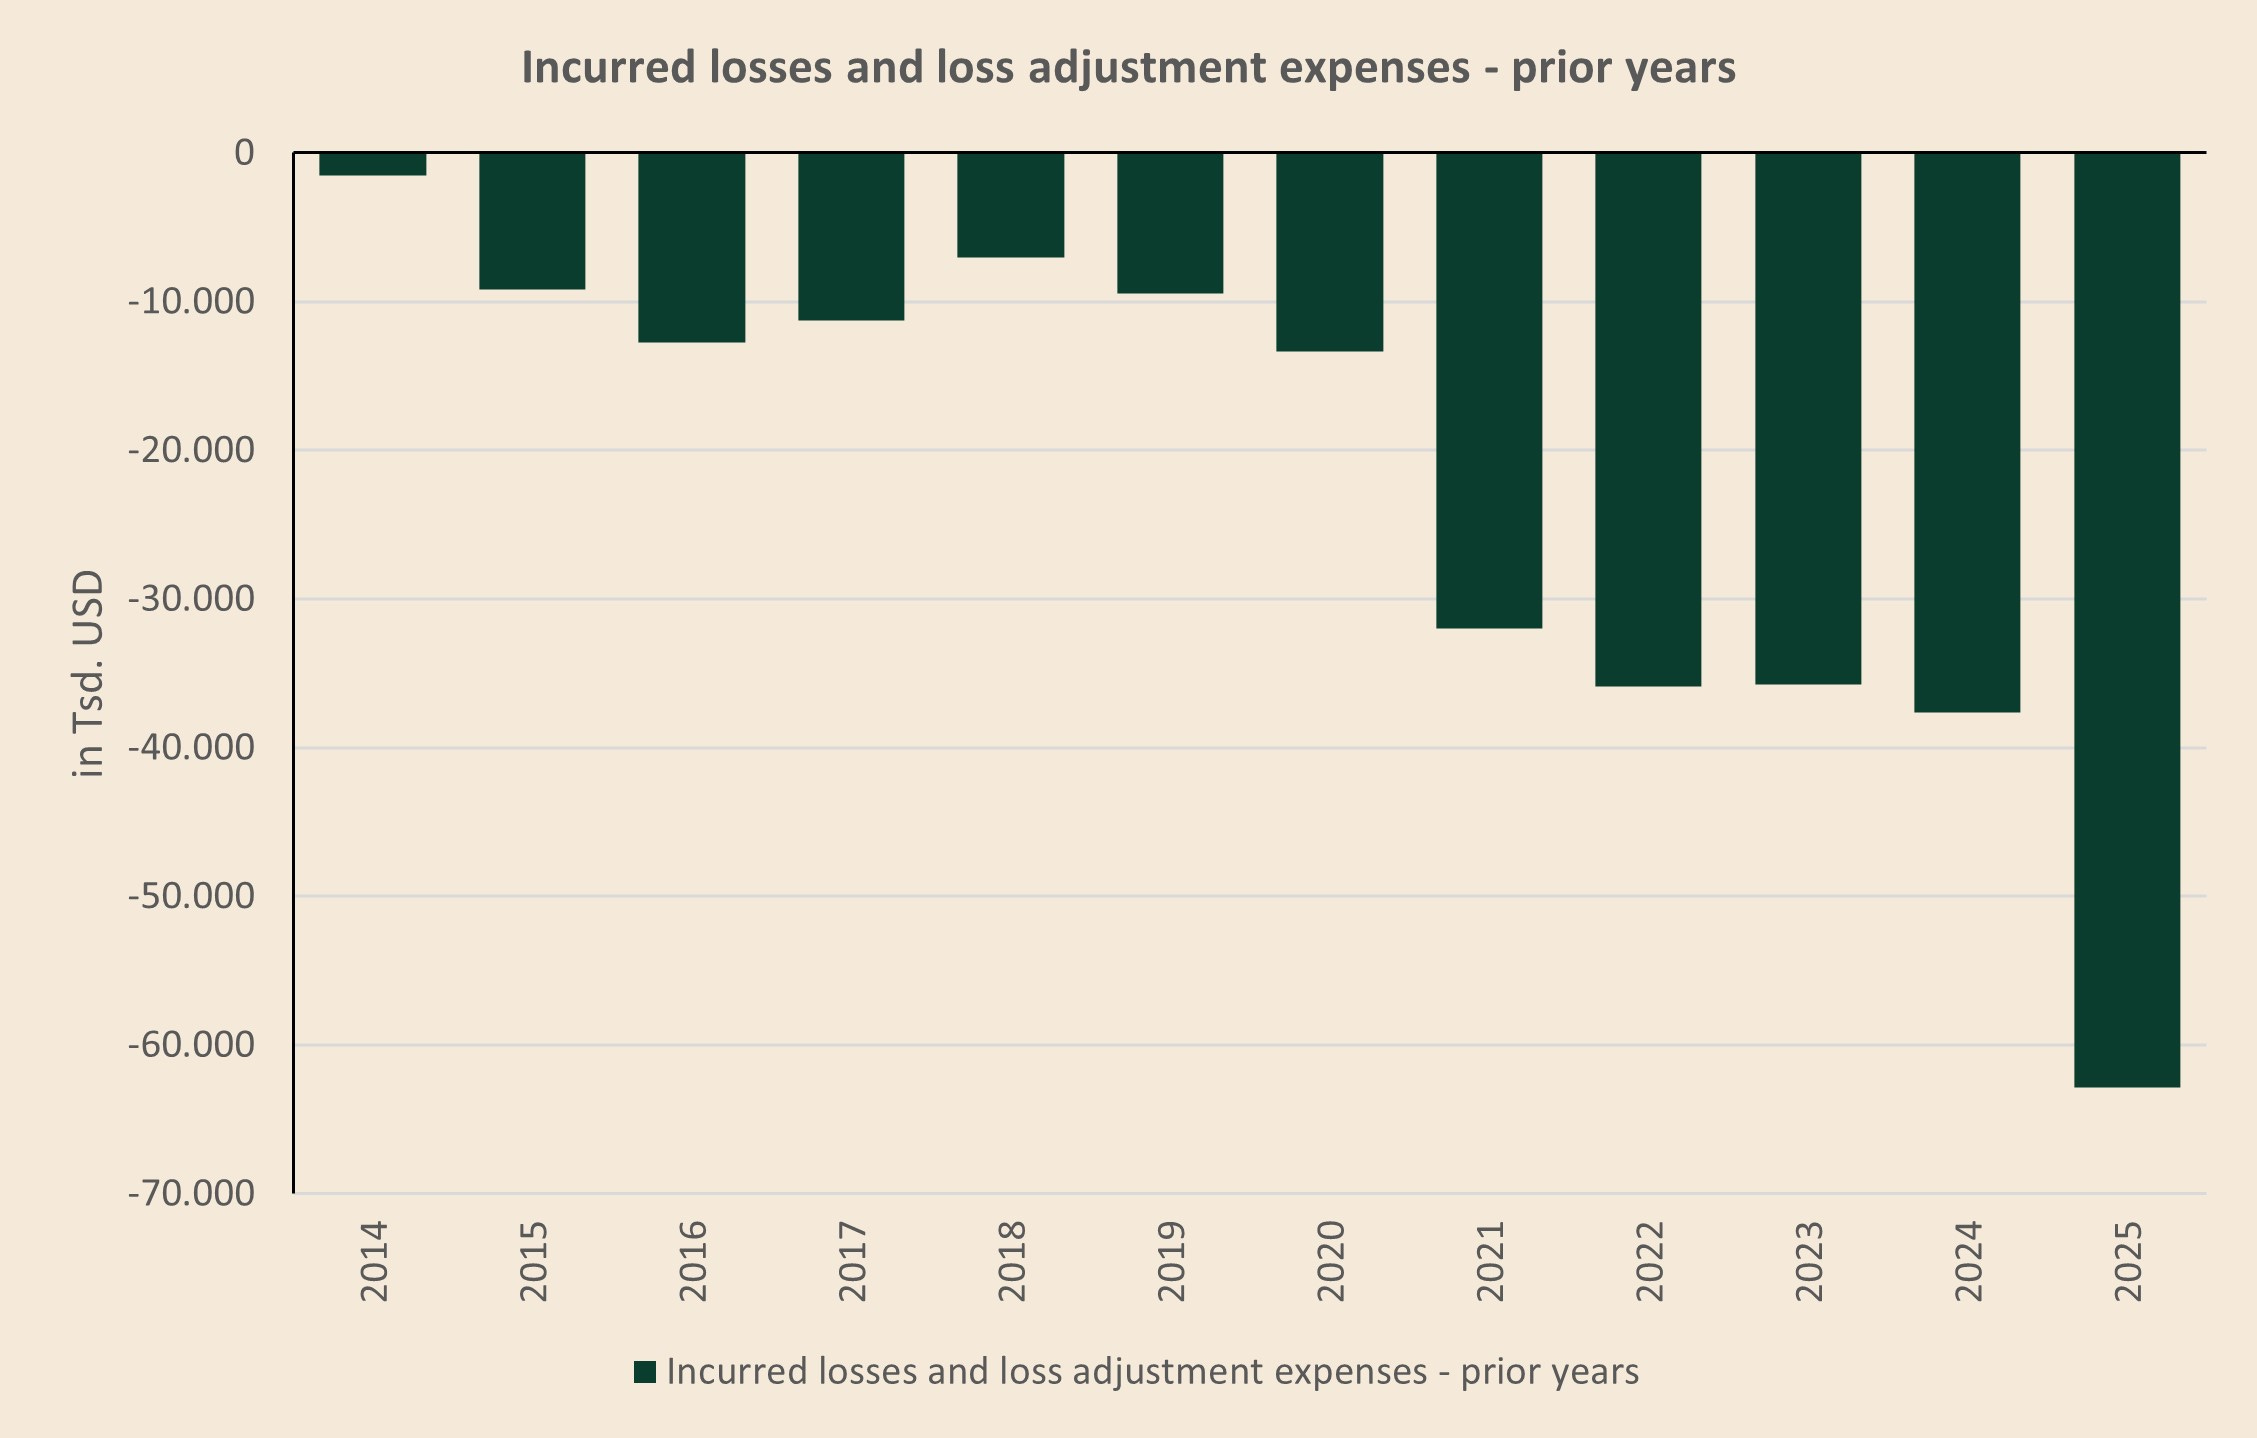
This chart makes it clear that Kinsale has reported negative one‑year PYD in every year so far. However, it does not split the result by line (property, casualty occurrence, and casualty claims‑made).
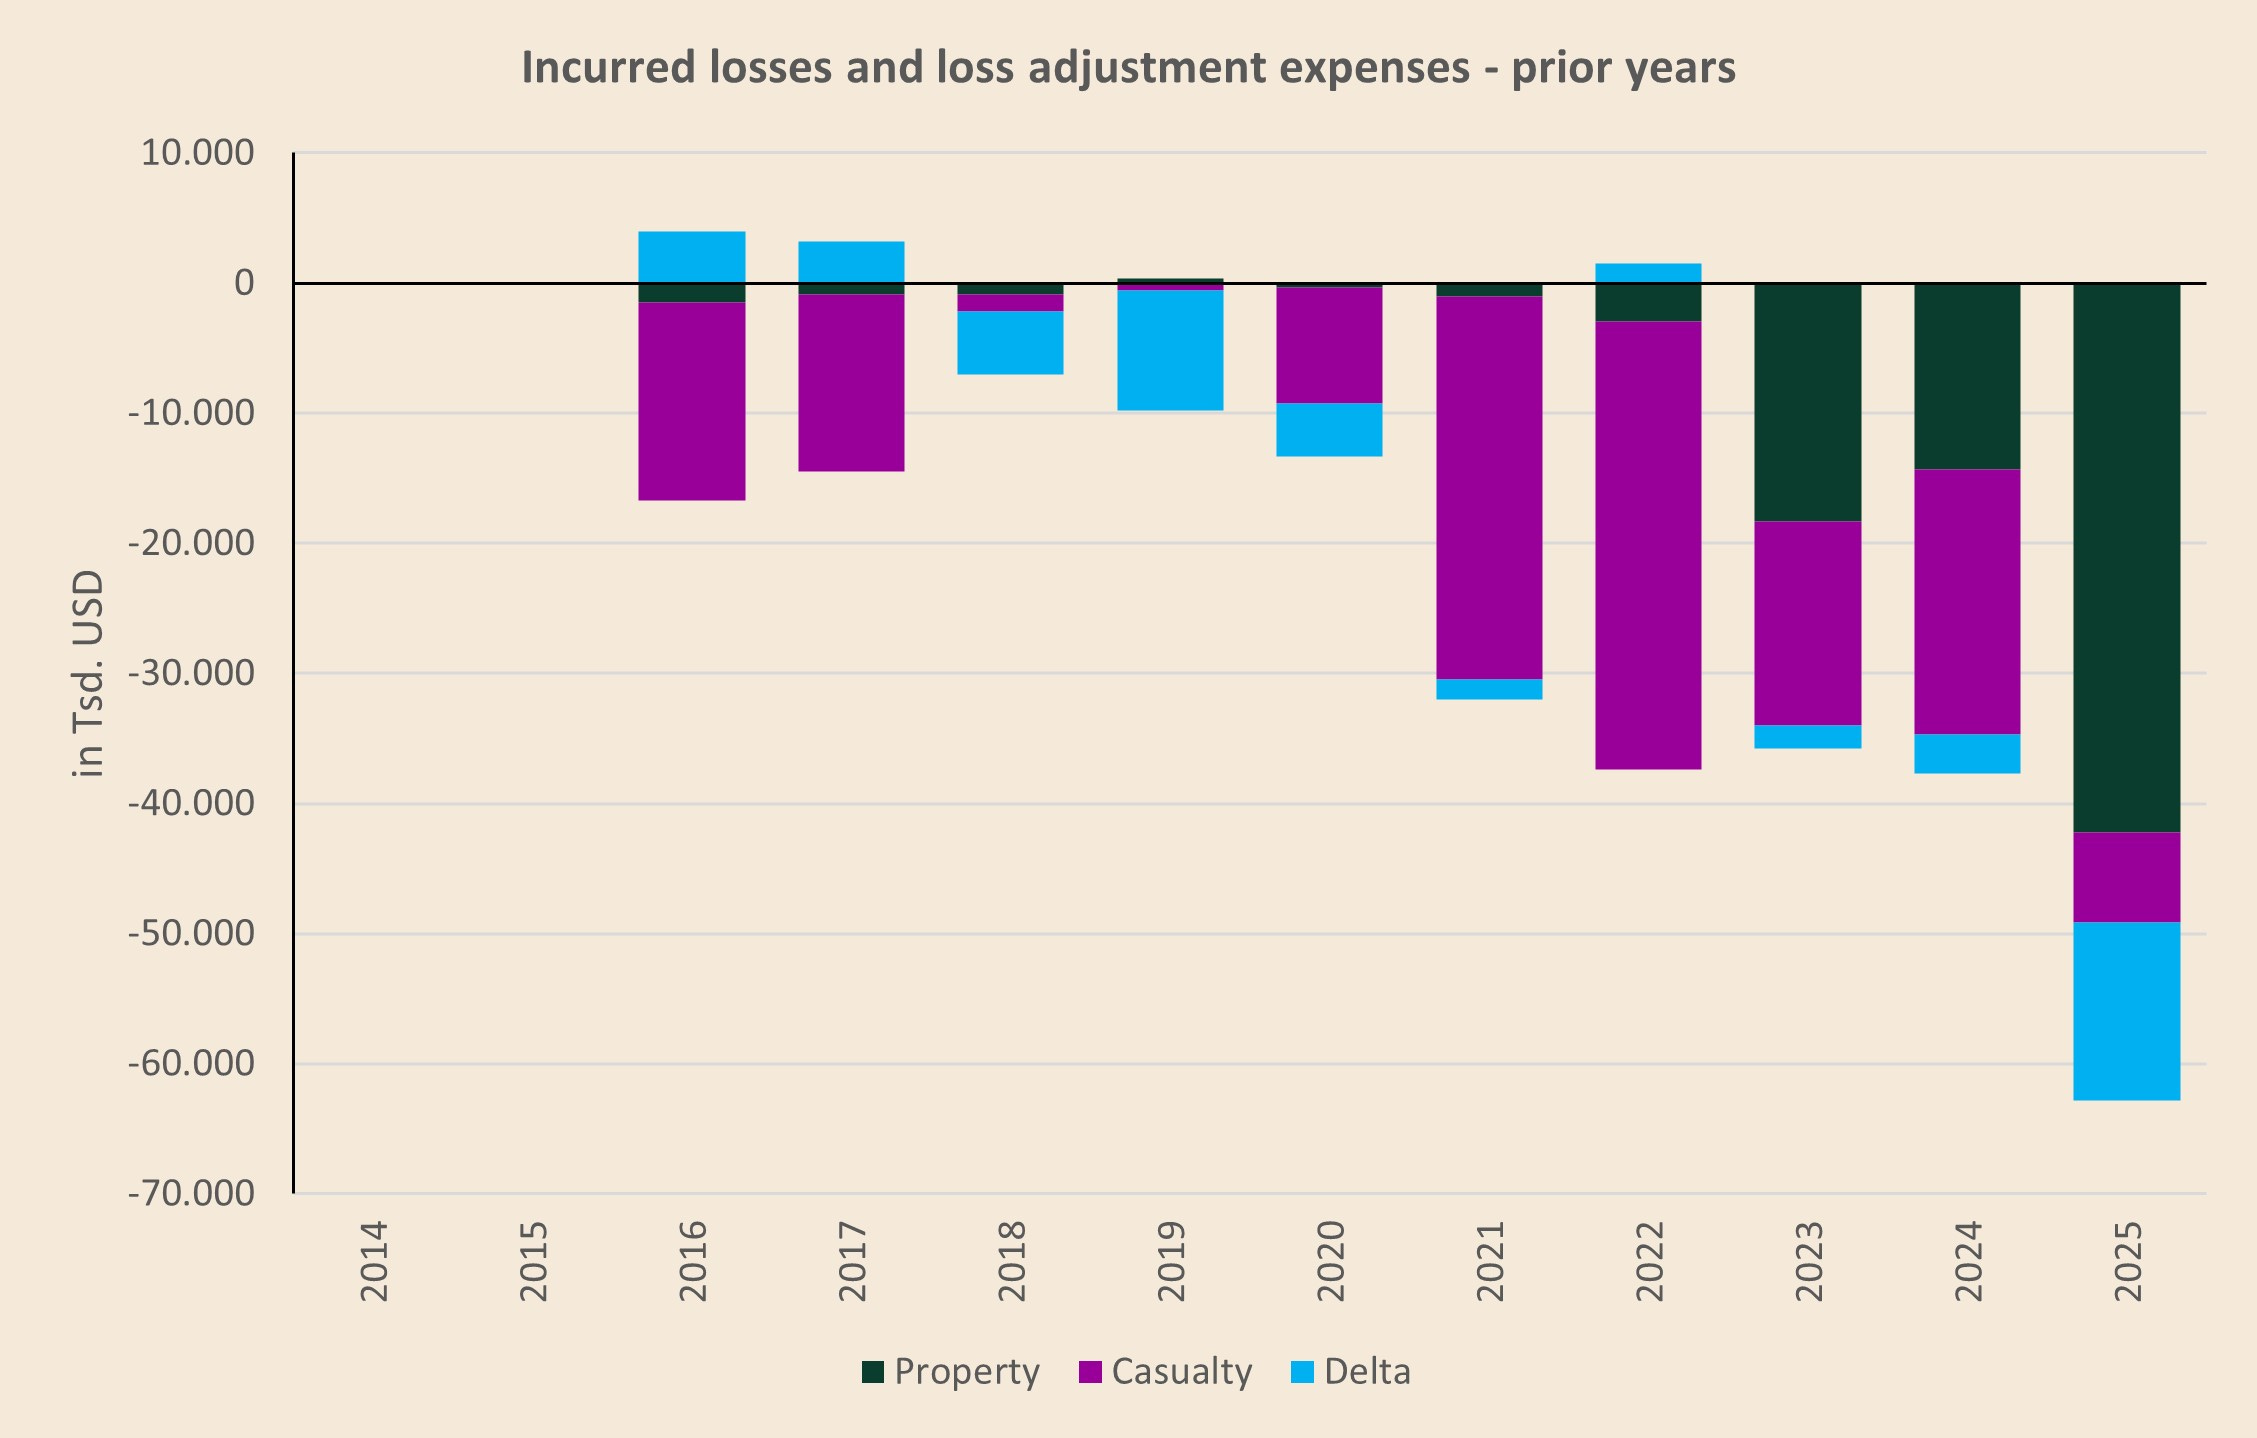
Using the loss triangles in the 10‑K, we can break the one‑year PYD down more granularly across the three lines. The next chart shows that bridge:
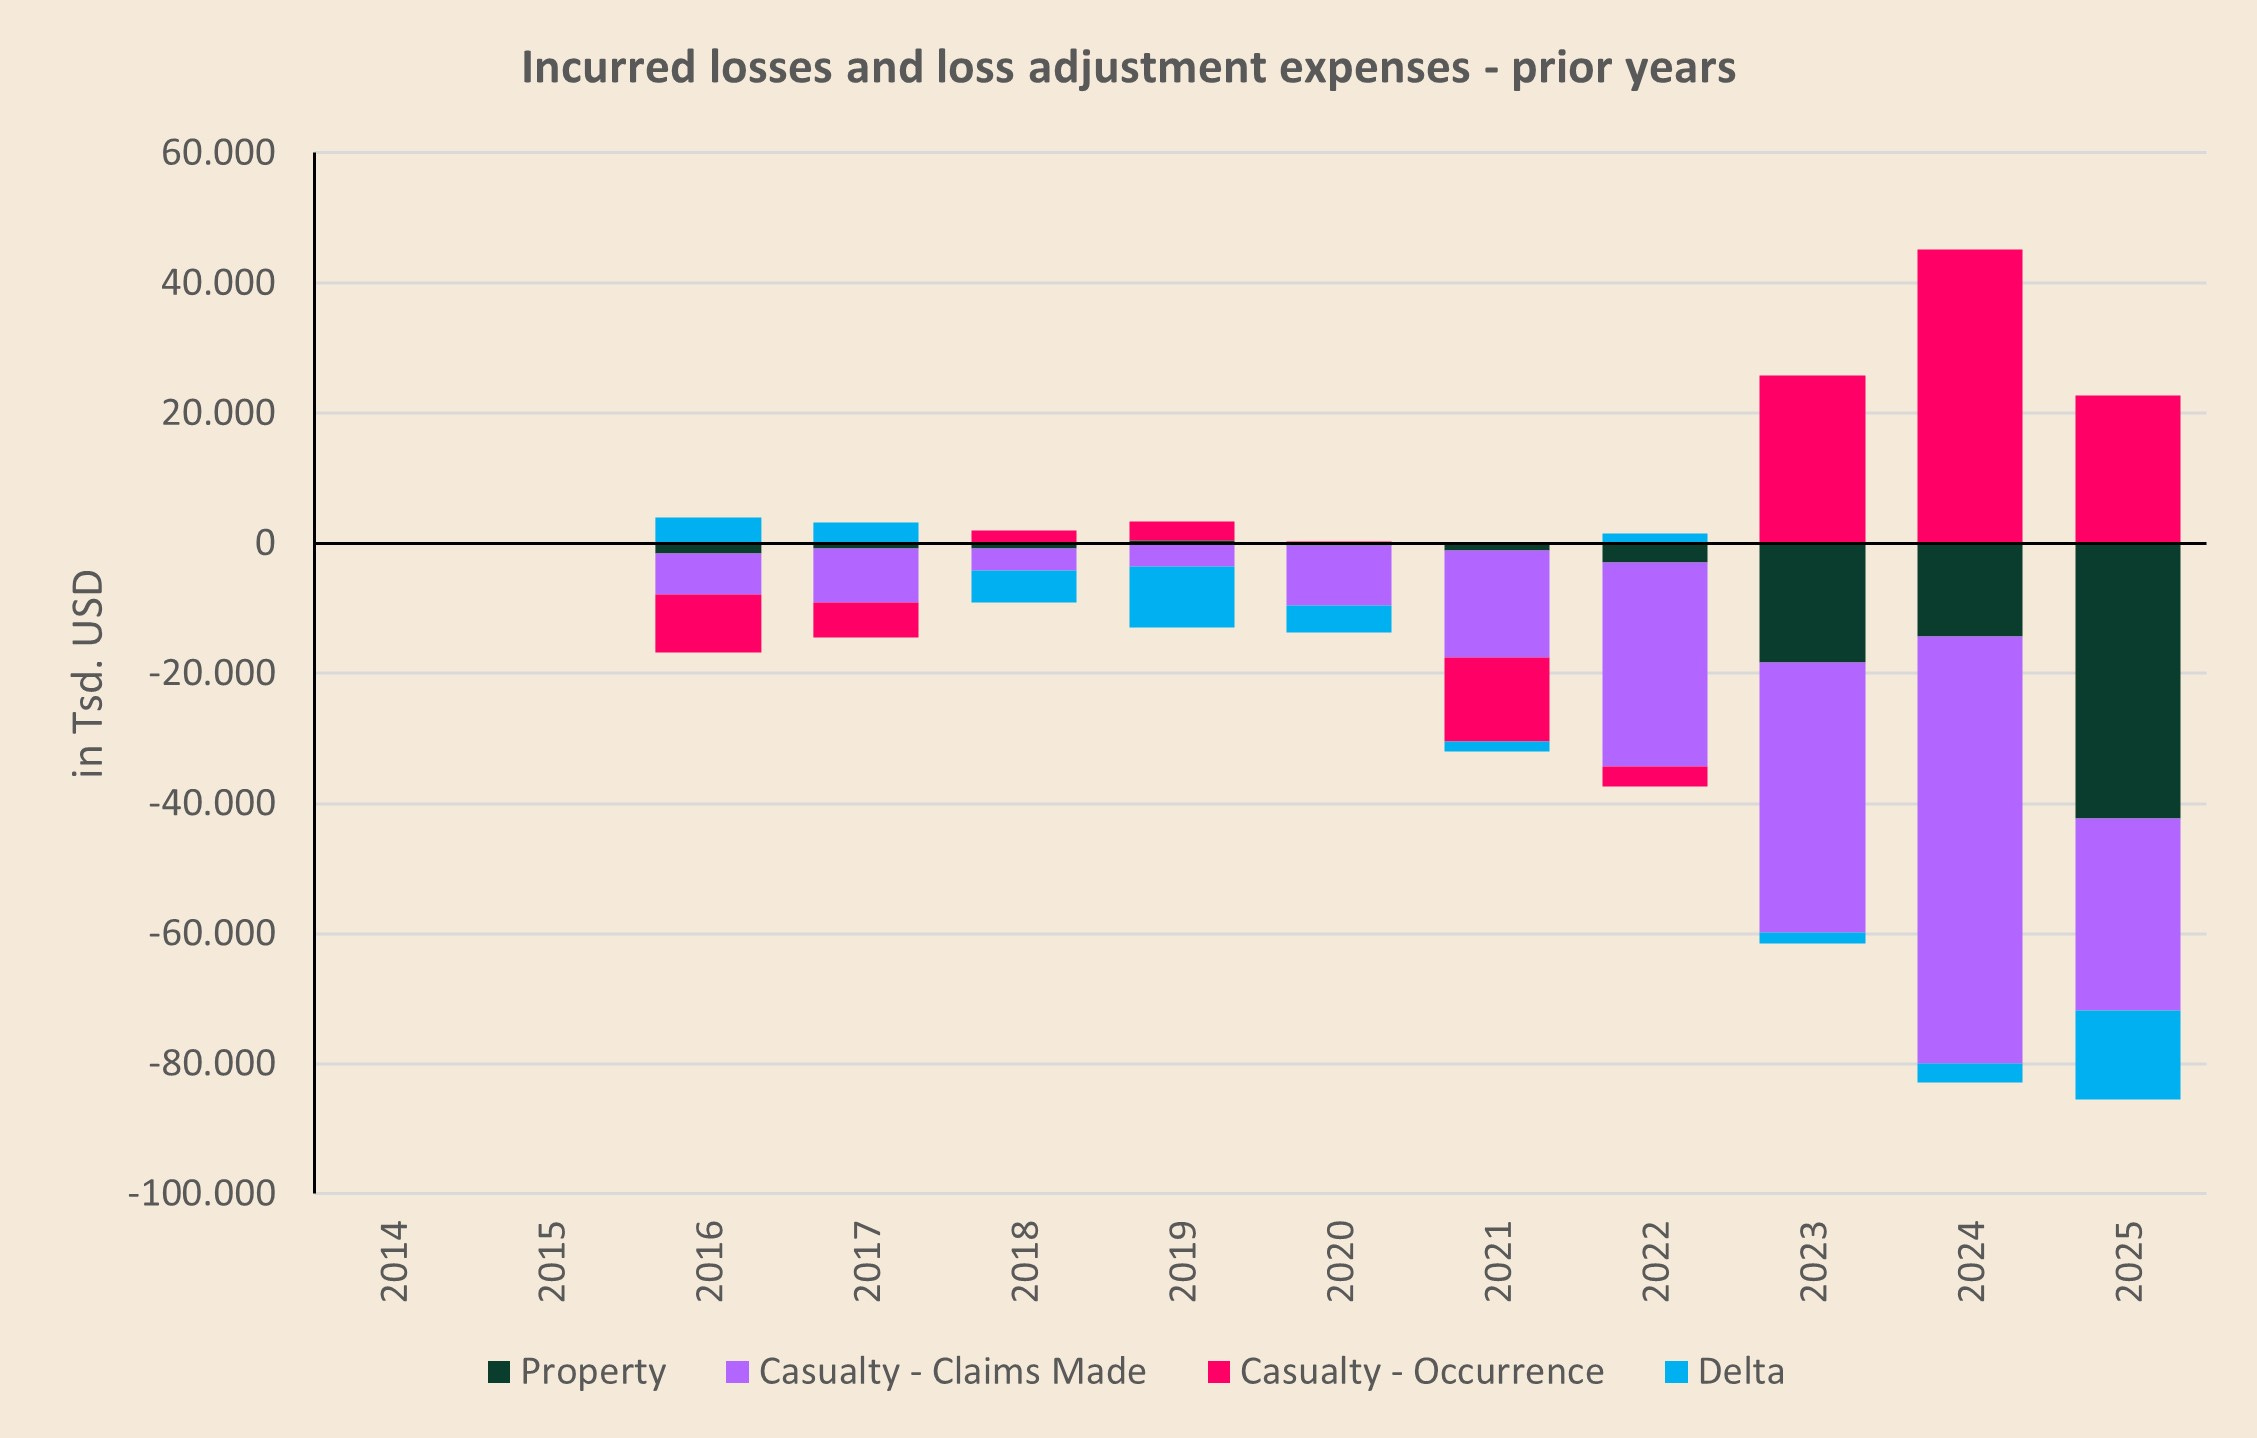
The blue “delta” bars are simply the residual caused by limited disclosure (for example, property triangles are only disclosed for a limited number of 5 years, so you can’t compute the full history). In other words, the delta is the net PYD that sits outside what we can attribute cleanly to the three disclosed buckets.
What stands out: property and casualty claims‑made are consistently negative, while casualty occurrence shows positive PYD over the last three years — i.e., ultimate losses were revised upward relative to the original picks (a sign that those cohorts developed worse than initially estimated).
Let’s go step by step and focus on casualty occurrence for that reason.
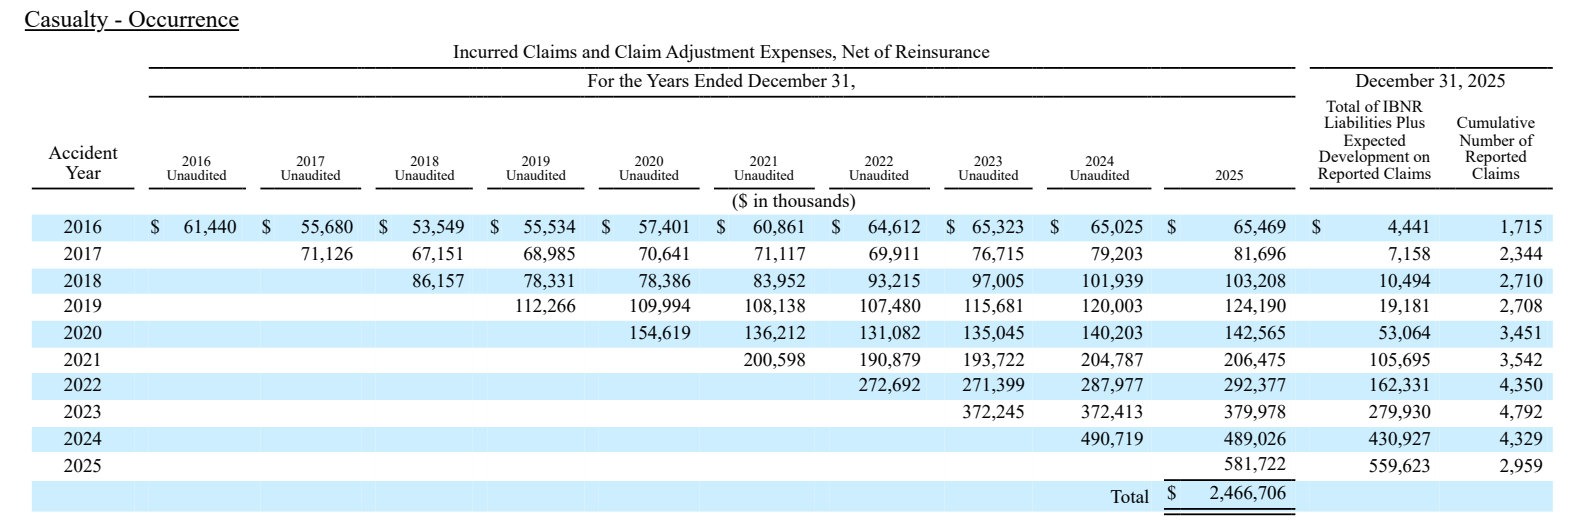
We start with the loss triangle (taken from Kinsale’s 10-K and extended with earlier years where possible). You can also see the disclosure limitation here: only ten years are shown, so everything beyond year 10 is effectively a black box.
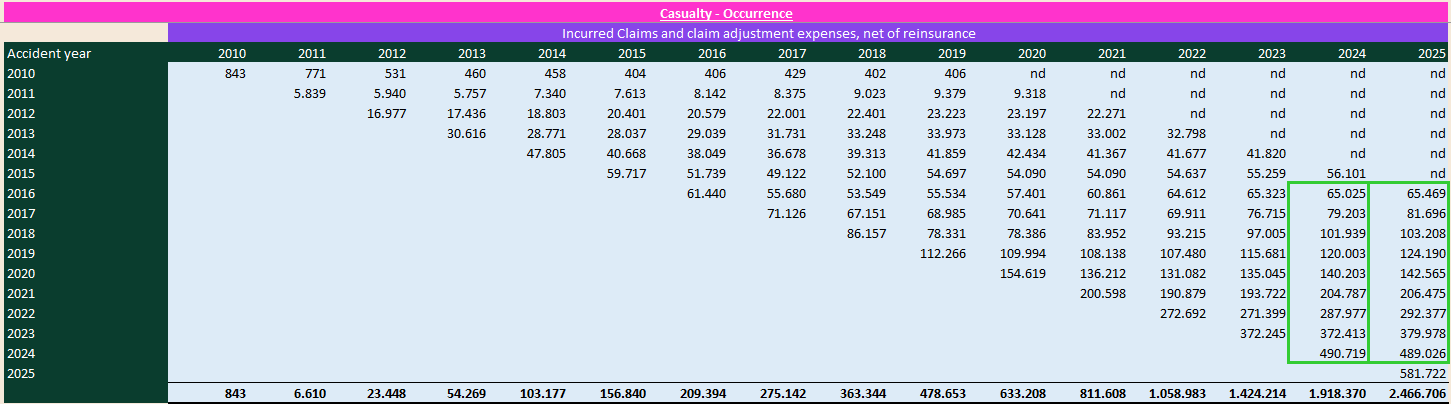
The sum of accident years 2016–2024 for casualty‑occurrence (highlighted in green) is:
As of 2024: $1,862.3 million
As of 2025: $1,885.0 million
So in 2025 the cumulative ultimate estimate for those accident years moved up by $22.7 million — the positive PYD that we also see in the bridge chart above for 2025 (the red bar).
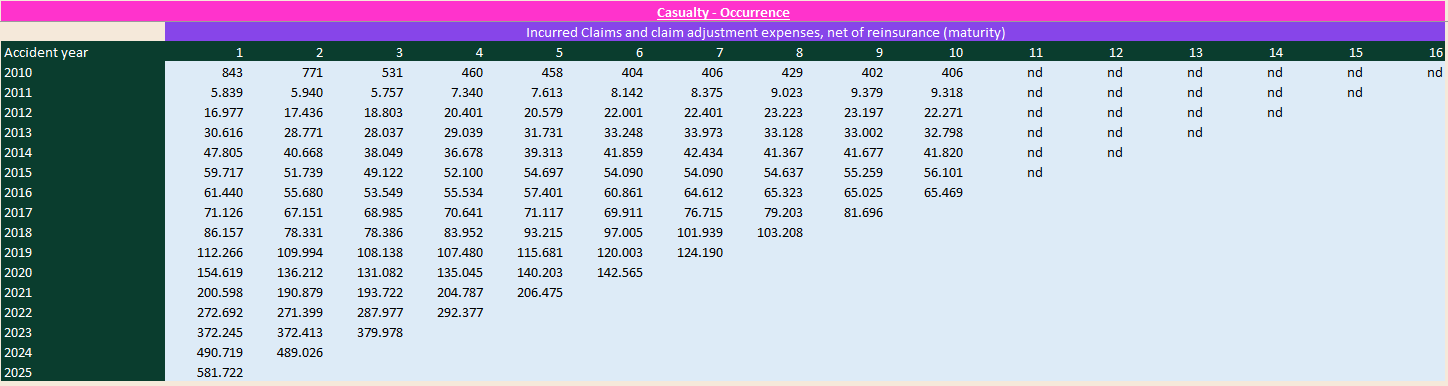
It gets even more interesting if we re‑arrange the triangle by maturity cohorts:
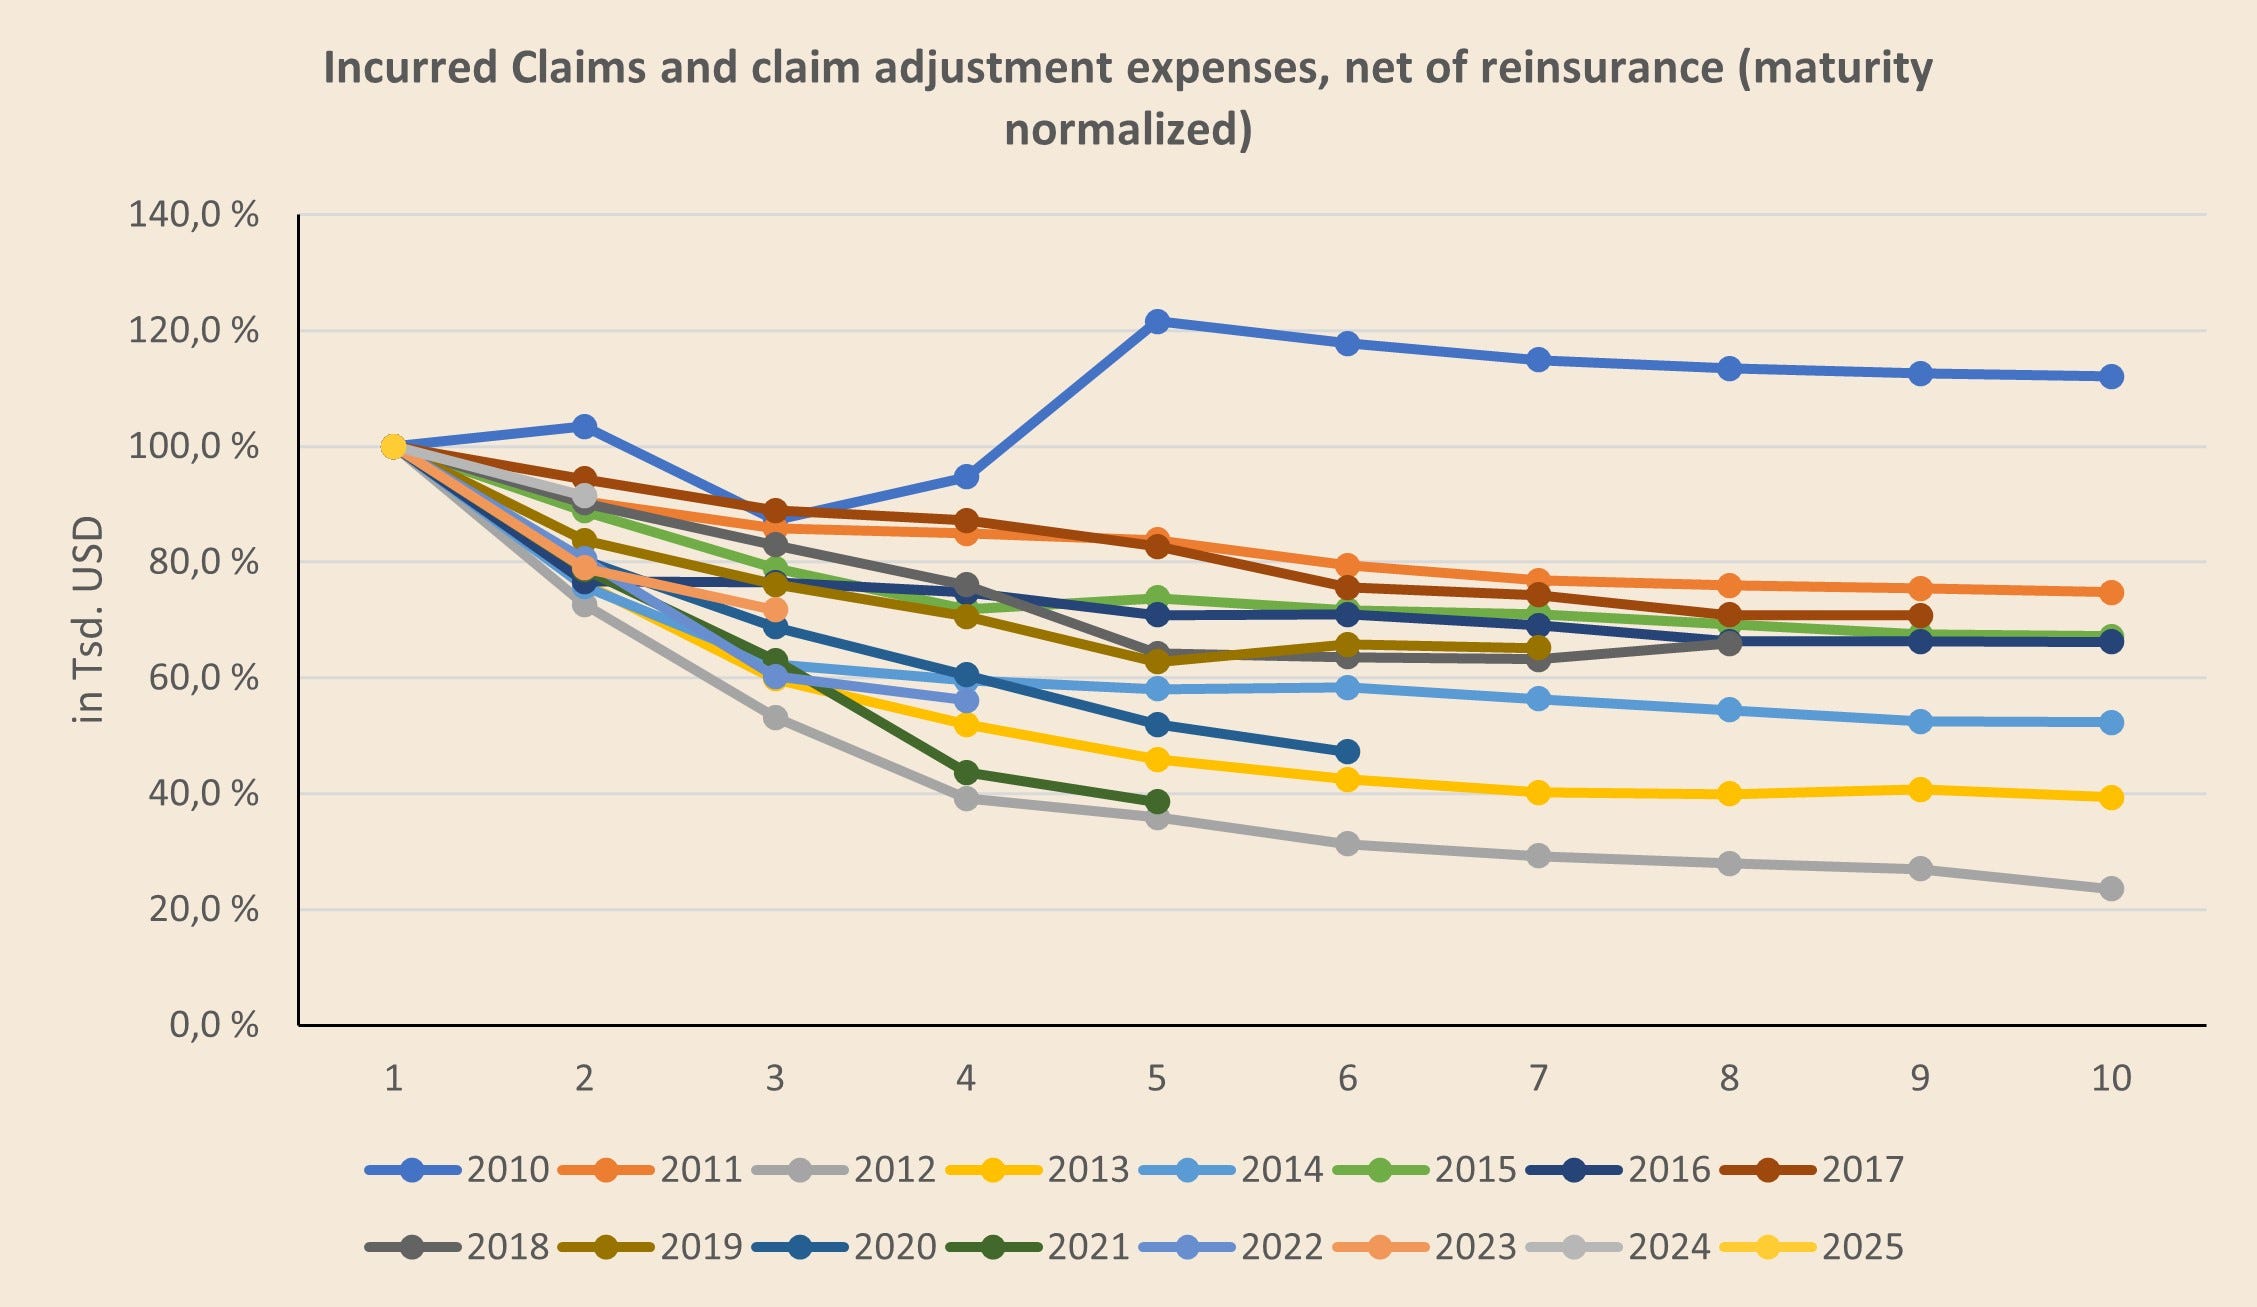
Next, we can express each accident year’s subsequent development relative to its first evaluation year (set to 100%). That gives us a clean relative view of multi‑year development by accident year.
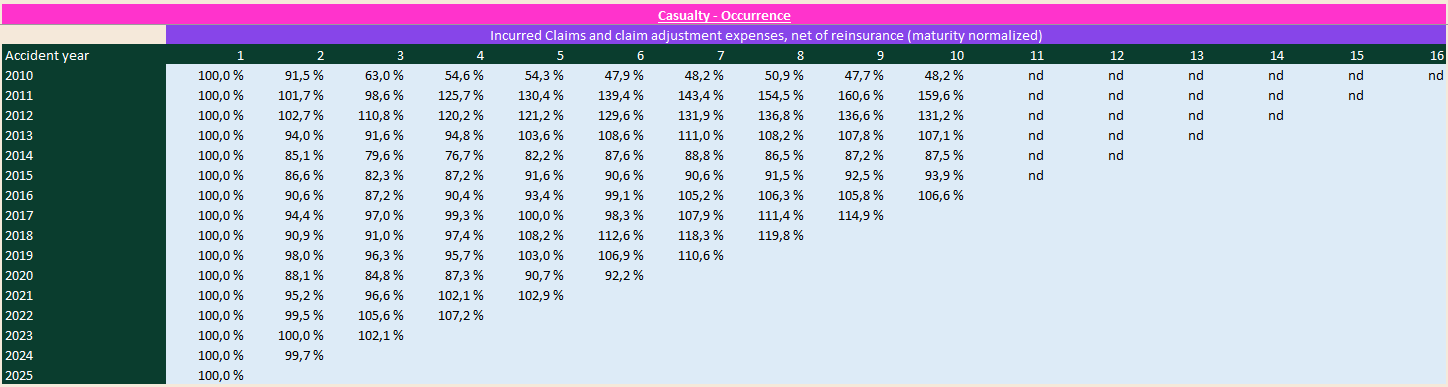
Visually, it looks like this:
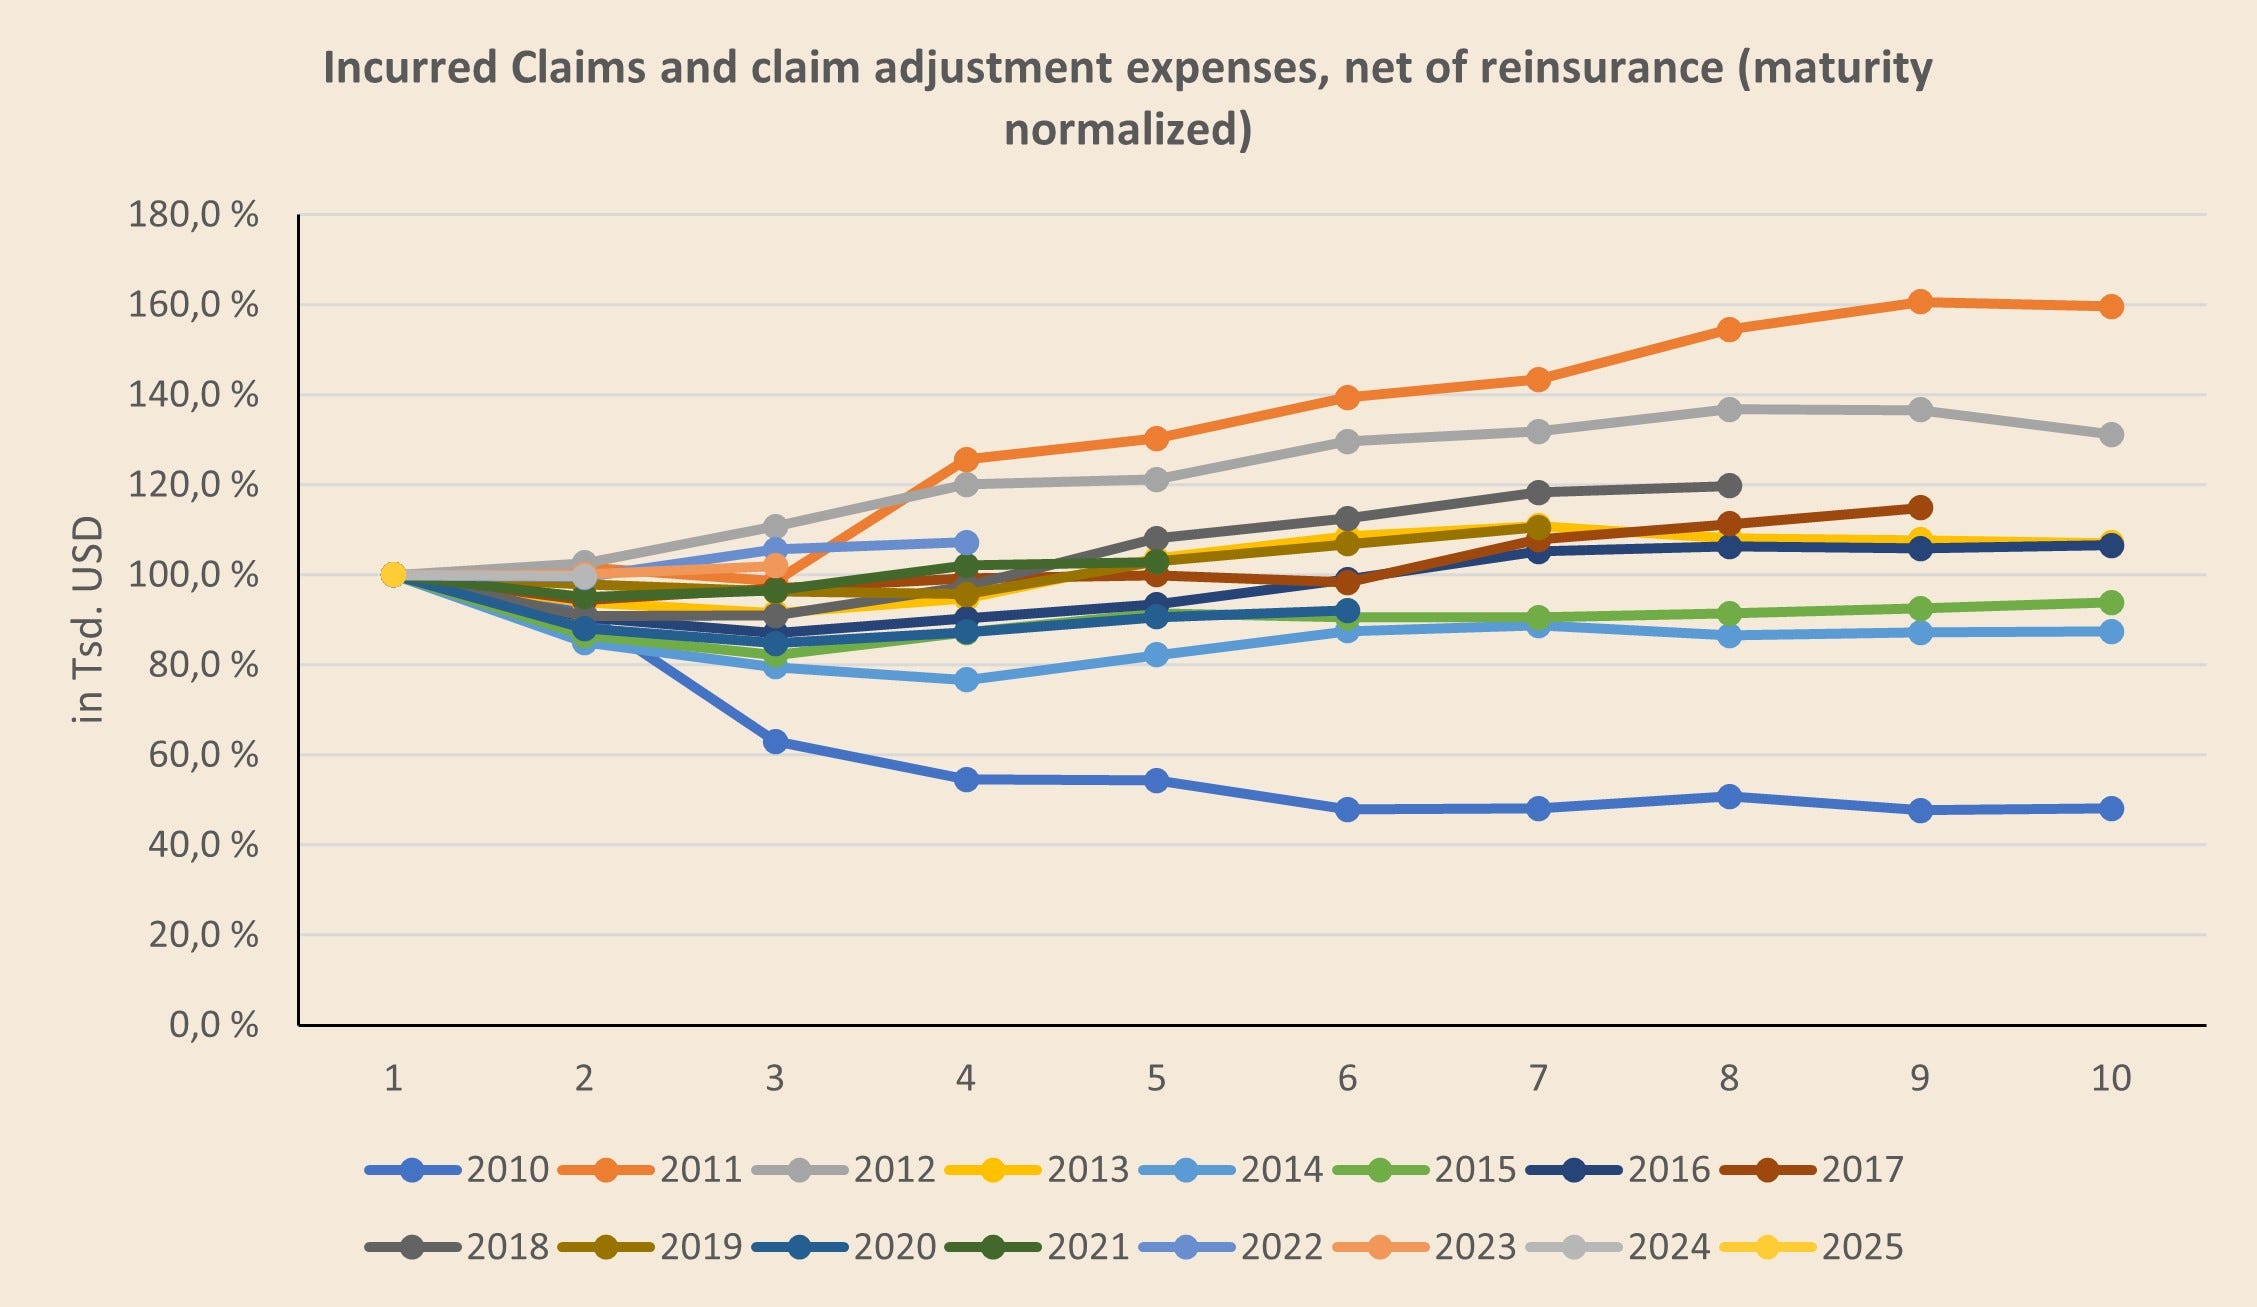
If a curve sits above 100%, the initial estimate was too low and multi‑year development is adverse (while single year PYD’s can still be negative and vice verca!). If it sits below 100%, the initial estimate was conservative and development is favorable.
As of December 31, 2025, the following accident years are above 100%:
2016: 106.6%
2017: 114.9%
2018: 110.6%
2021: 102.9%
2022: 107.2%
2023: 102.1%
It’s quite possible that accident years 2011–2013 are also above 100%, but we can’t verify that with certainty given the disclosure cutoff after 10 years.
Now compare that to casualty claims‑made. As you’d expect, most accident years sit below 100% — in some cases by a wide margin. For example, the original ultimate estimate for accident year 2021 has been reduced to roughly ~38% of the initial estimate by year‑end 2025.
For casualty claims-made policies, Kinsale’s overall PYD has been predominantly favorable, while casualty occurrence shows adverse development in several accident years. Roughly 70–75% of casualty GWP is occurrence and 25–30% is claims‑made, so occurrence is the bigger driver inside casualty.
On a combined basis for claims-made and occurrence, casualty still shows negative one‑year PYD (and therefore also negative multi‑year development overall):
What does this imply for underwriting quality going forward?
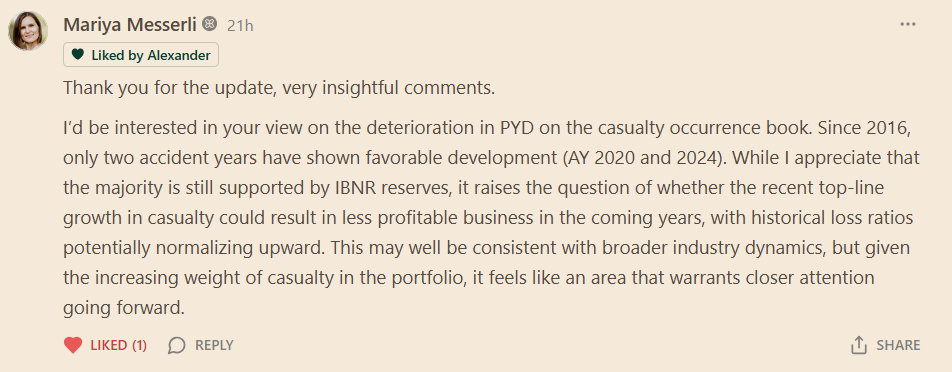
Mariya’s question is the right one: does adverse development in the casualty occurrence book mean Kinsale historically underpriced risk — and could today’s casualty growth show up as weaker profitability a few years from now?
My take: the triangles do tell us that several occurrence cohorts developed worse than the initial picks. But I would be careful jumping from that to “the business was underpriced.” Occurrence casualty is long‑tailed and heavily influenced by severity trends, social inflation, litigation dynamics, and mix shifts. Any of those can push ultimates higher even if pricing discipline was solid at the time.
The forward‑looking risk is real, though: if loss cost trends keep running hot and pricing momentum cools, then accident years written during the growth phase can “normalize” upward as they season. That’s why I treat occurrence casualty as a monitoring item — not a thesis breaker.
Additionally, I reached out to the CFO, Bryan Petricelli, and he explained that IBNR makes up a higher portion of the Ultimate Losses for the more recent accident years compared to the same age/time lag for older accident years. In other words, Kinsale is booking more IBNR than they used to. On the contrary, paid losses make up a smaller portion of Kinsale’s Ultimate Losses for the more recent accident years compared to the same age/time lag for older accident years.
“This is Kinsale being more conservative with our reserves on the Casualty Occuerrence business.” (Bryan Petricelli)
As a reminder:
IBNR and case reserves are two very different kinds of “unpaid losses,” and mixing them up can lead to the wrong conclusion.
Case reserves are tied to known claims. A loss has been reported, a file exists, and the adjuster has set an estimated remaining payout. Case reserves are therefore relatively “visible”: the claim has already emerged, and future development depends mostly on how that claim ultimately settles (severity, litigation, coverage disputes, claims handling).
IBNR (incurred but not reported) is the opposite: it covers losses that are not yet on the radar (or not yet adequately reflected in case reserves). That makes IBNR more model-driven and inherently more uncertain. A higher IBNR share usually means the insurer is booking more of the ultimate loss before it shows up in reported claims—which can be prudent, but it also means more of the reserve is based on actuarial assumptions and can move as new information arrives.
That’s why the split matters. “Unpaid” can be high for benign reasons (timing, conservatism) or for uncomfortable reasons (late-emerging loss experience). Looking at how much of unpaid is IBNR vs. case helps you judge whether you’re mainly dealing with known claims working through the system or unknown claims that haven’t emerged yet and which accident years are likely to produce the next wave of reserve development.
What ultimately matters to me is that overall prior-year development stays favorable, and that Kinsale can keep generating 20%+ ROE over the long run.