
⚠️ Kelly Partners’ EBITDA & Owners' Earnings Aren't What You Think
Consolidated EBITDA looks fantastic—until you follow the cash to non-controlling interests.

Note that Part I of my upcoming HEICO Deep Dive will be published on Sunday, July 19.
Not many people want to hear what I’m about to say about KPG.
This may not make me popular.
At first glance, Kelly Partners looks like a classic “quality compounder”: a steady, recurring-revenue professional services business that grows through acquisitions in a large, fragmented market, posts attractive margins, and is led by a (seemingly) highly incentivized founder.
But once you look beneath the surface, a few things start to bother me. The issue isn’t the business itself. It’s the math and how the deal structures can make consolidated financials look far better than the economics that are actually attributable to shareholders.
The business model
Kelly Partners Group (KPG) was founded in 2006 by Brett Kelly. KPG is a programmatic acquirer of tax and accounting firms. The early focus was Australia (major metro areas), but more recently, the group has expanded into the UK and the U.S. (All figures in A$ unless noted.)
The market itself is structurally attractive. Tax and accounting services are high-retention and relationship-driven, especially for SMEs and private clients. Switching accounting firm is possible, but the switching costs are real: years of accumulated know-how would get lost. In practice, most business owners don’t wake up thinking, “Today I’m shopping for a new accountant.” If the work is solid and deadlines are met, inertia is powerful.
And believe me: sometimes the accountant knows more than the client’s own spouse. I’m speaking from experience—I spent several years in audit and at a small accounting firm. Once you sit close enough to the numbers, you realize how much sensitive information flows through the accountant-client relationship. In extreme cases, that can even include “undisclosed” children and related financial obligations the spouse is not aware of—and is not meant to be aware of.
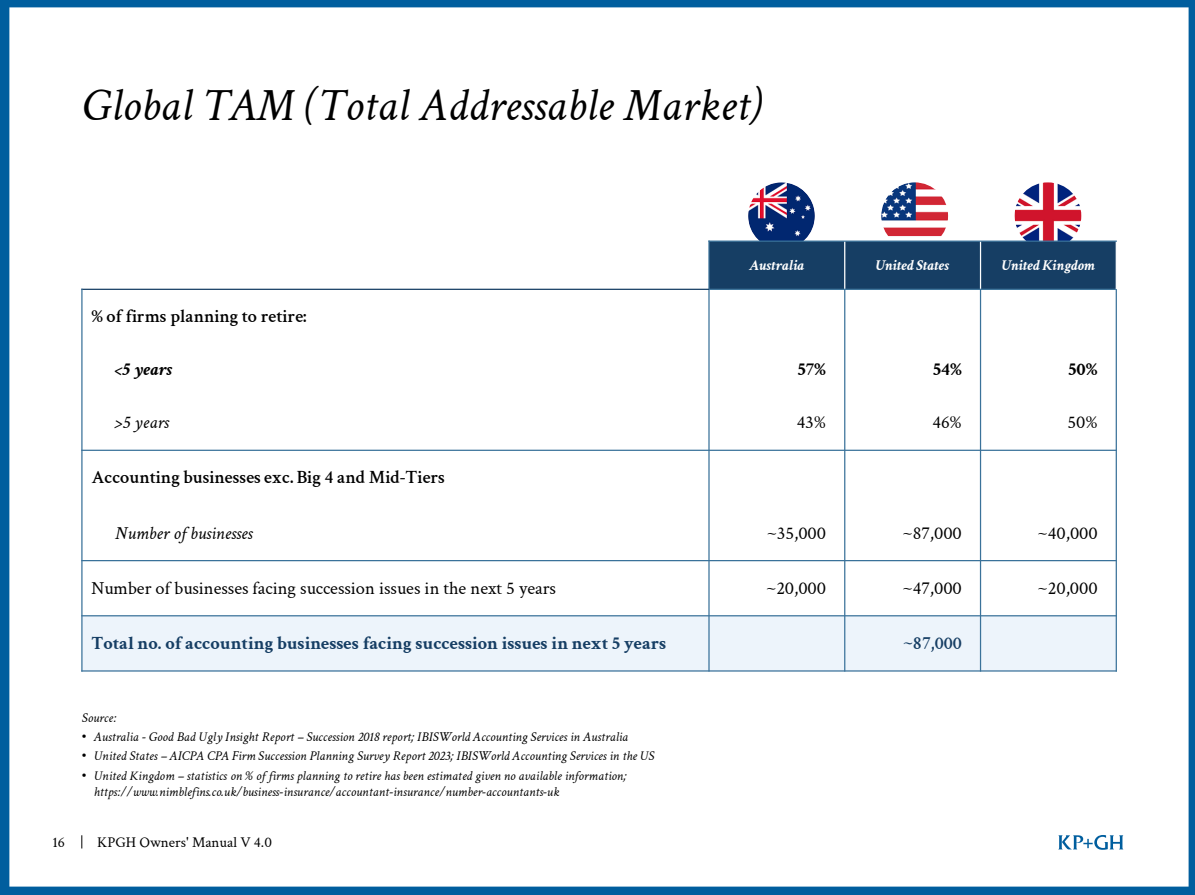
The accounting market is also deeply fragmented with many small local accounting firms, and the total addressable market is large. KPG argues that across its three operating markets there are roughly 87,000 smaller firms (excluding the Big 4 and mid-tiers) that could face succession by 2029. That would be about ~54% of roughly ~162,000 existing accounting firms. In other words: plenty of targets, and plenty of willing sellers.
According to KPG, the market is roughly $12.5 billion in size. With about $130 million in revenue, KPG still has less than 1% market share, which suggests a long runway for growth.
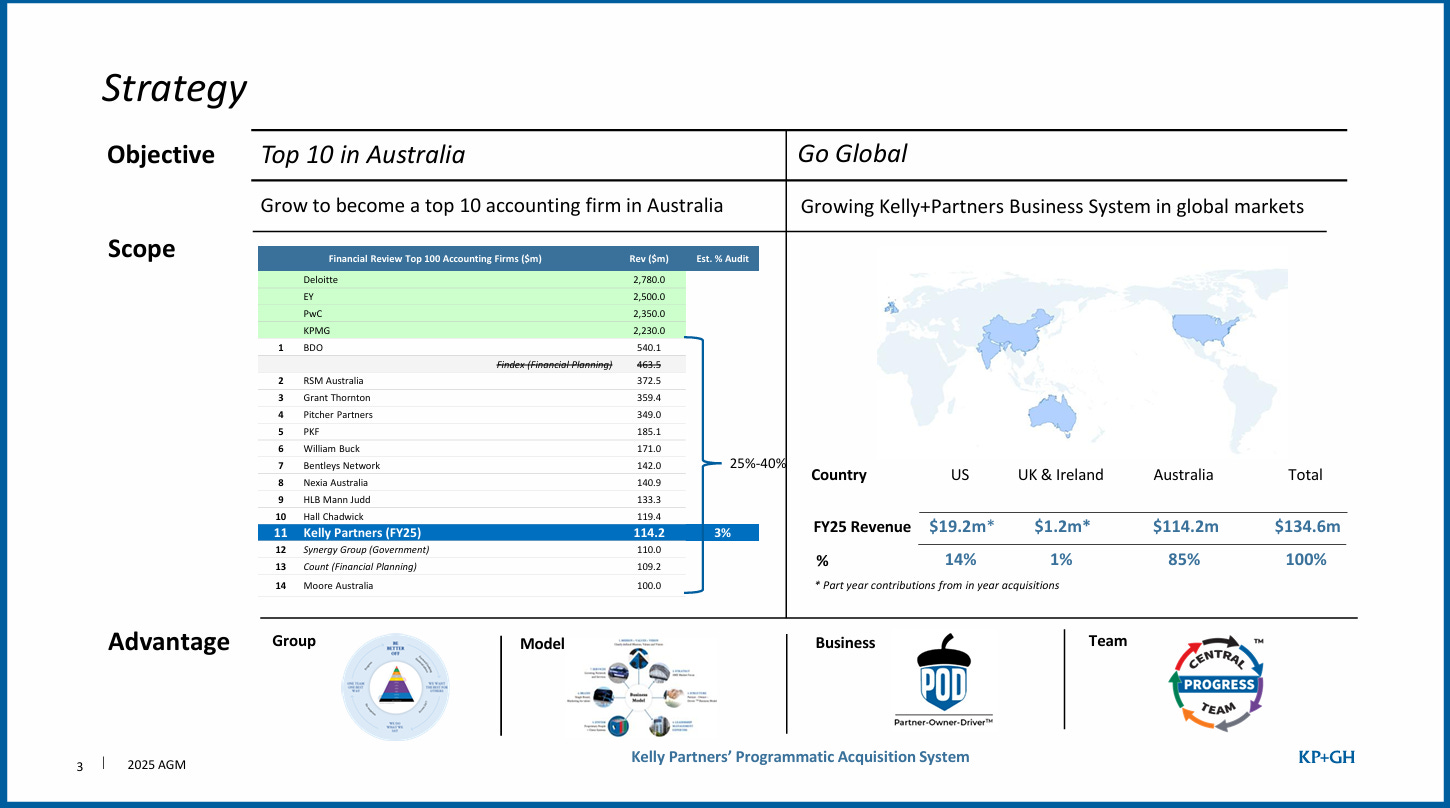
In Australia, KPG is now the 11th-largest accounting firm, with an estimated ~3% market share (excluding the Big 4: Deloitte, EY, PwC, and KPMG).
The bird’s-eye view
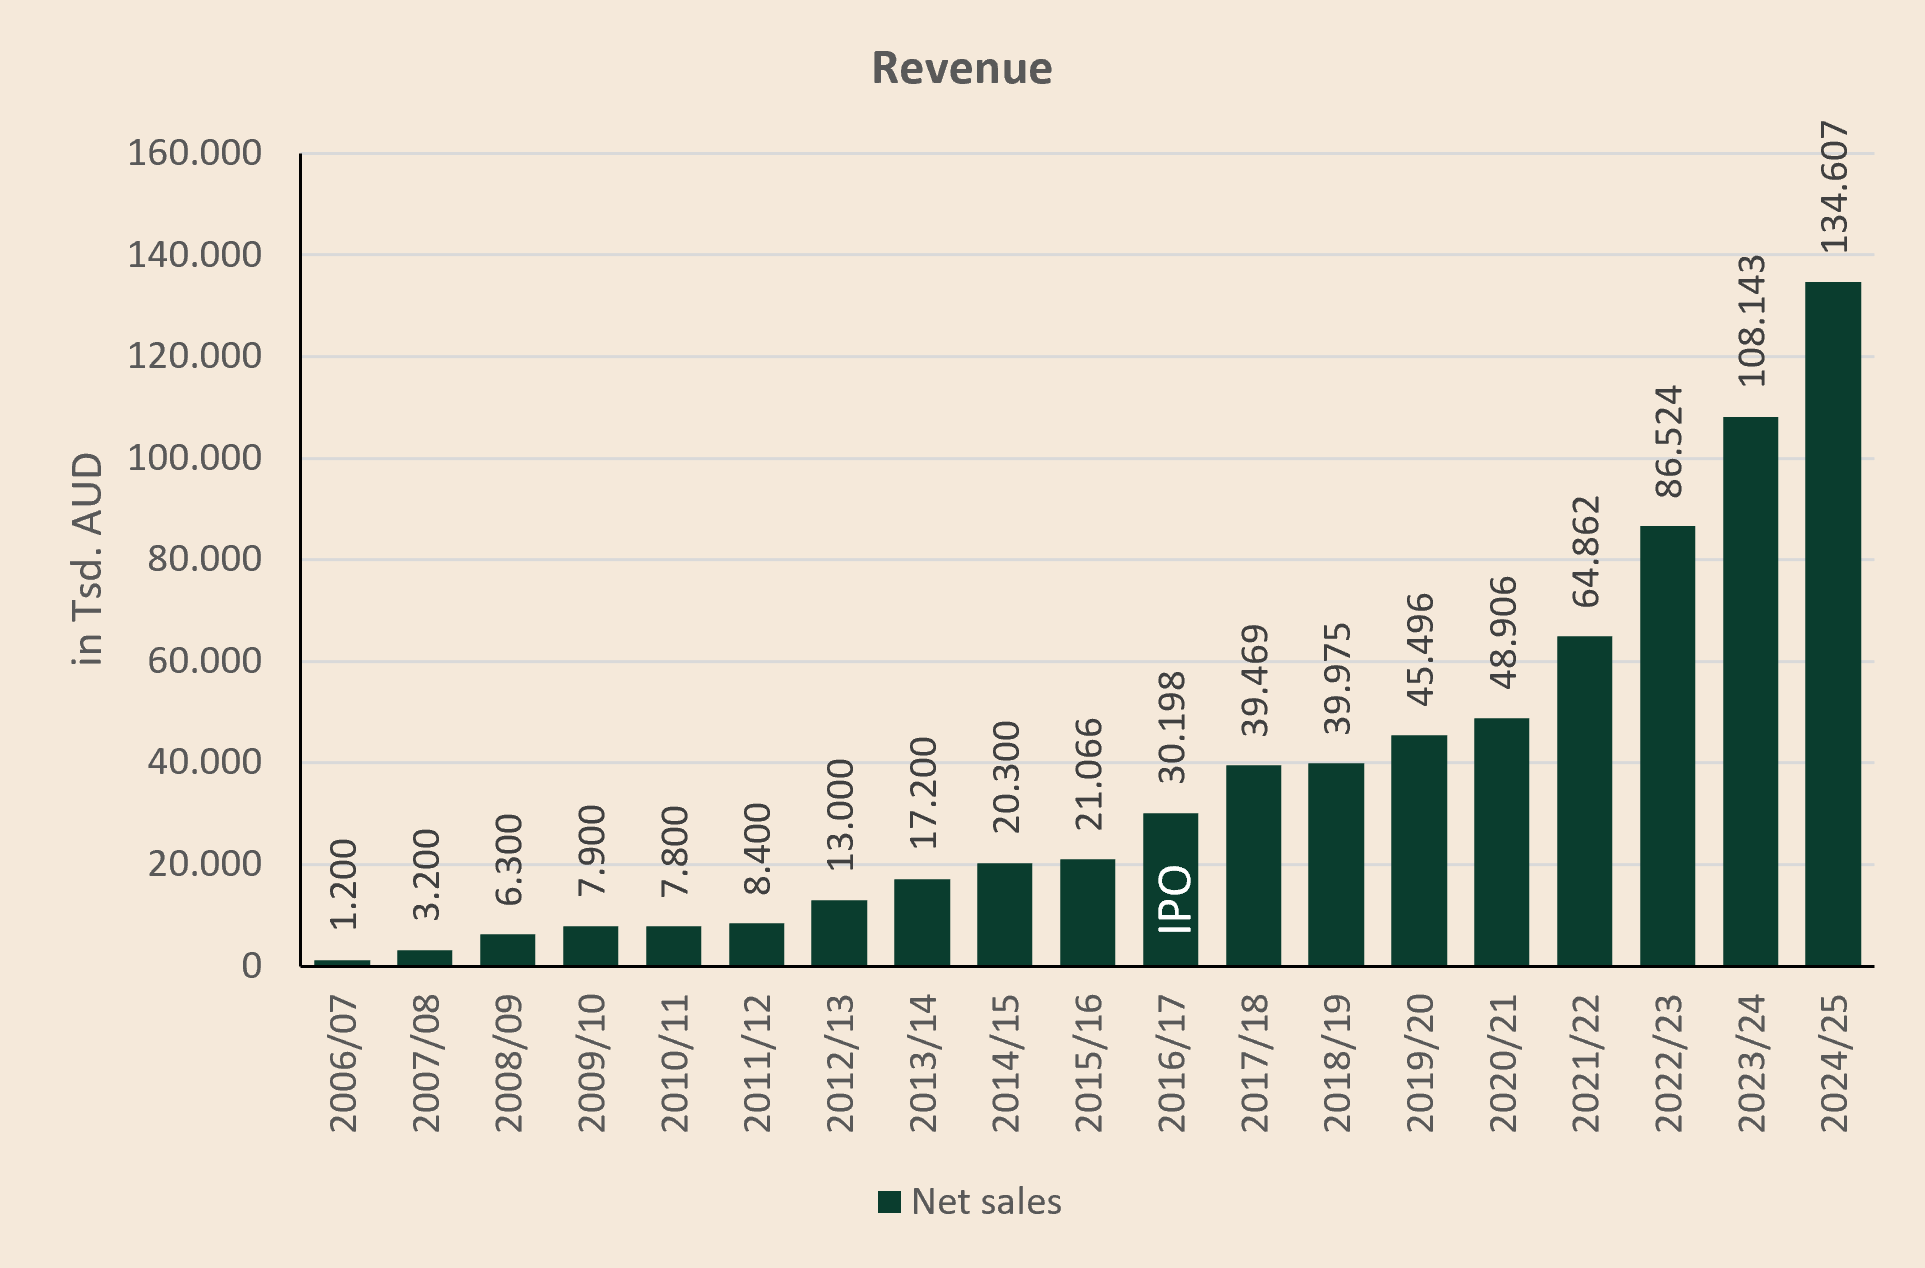
From 30,000 feet, the following chart is impressive: a ~25% revenue CAGR over 17 years…
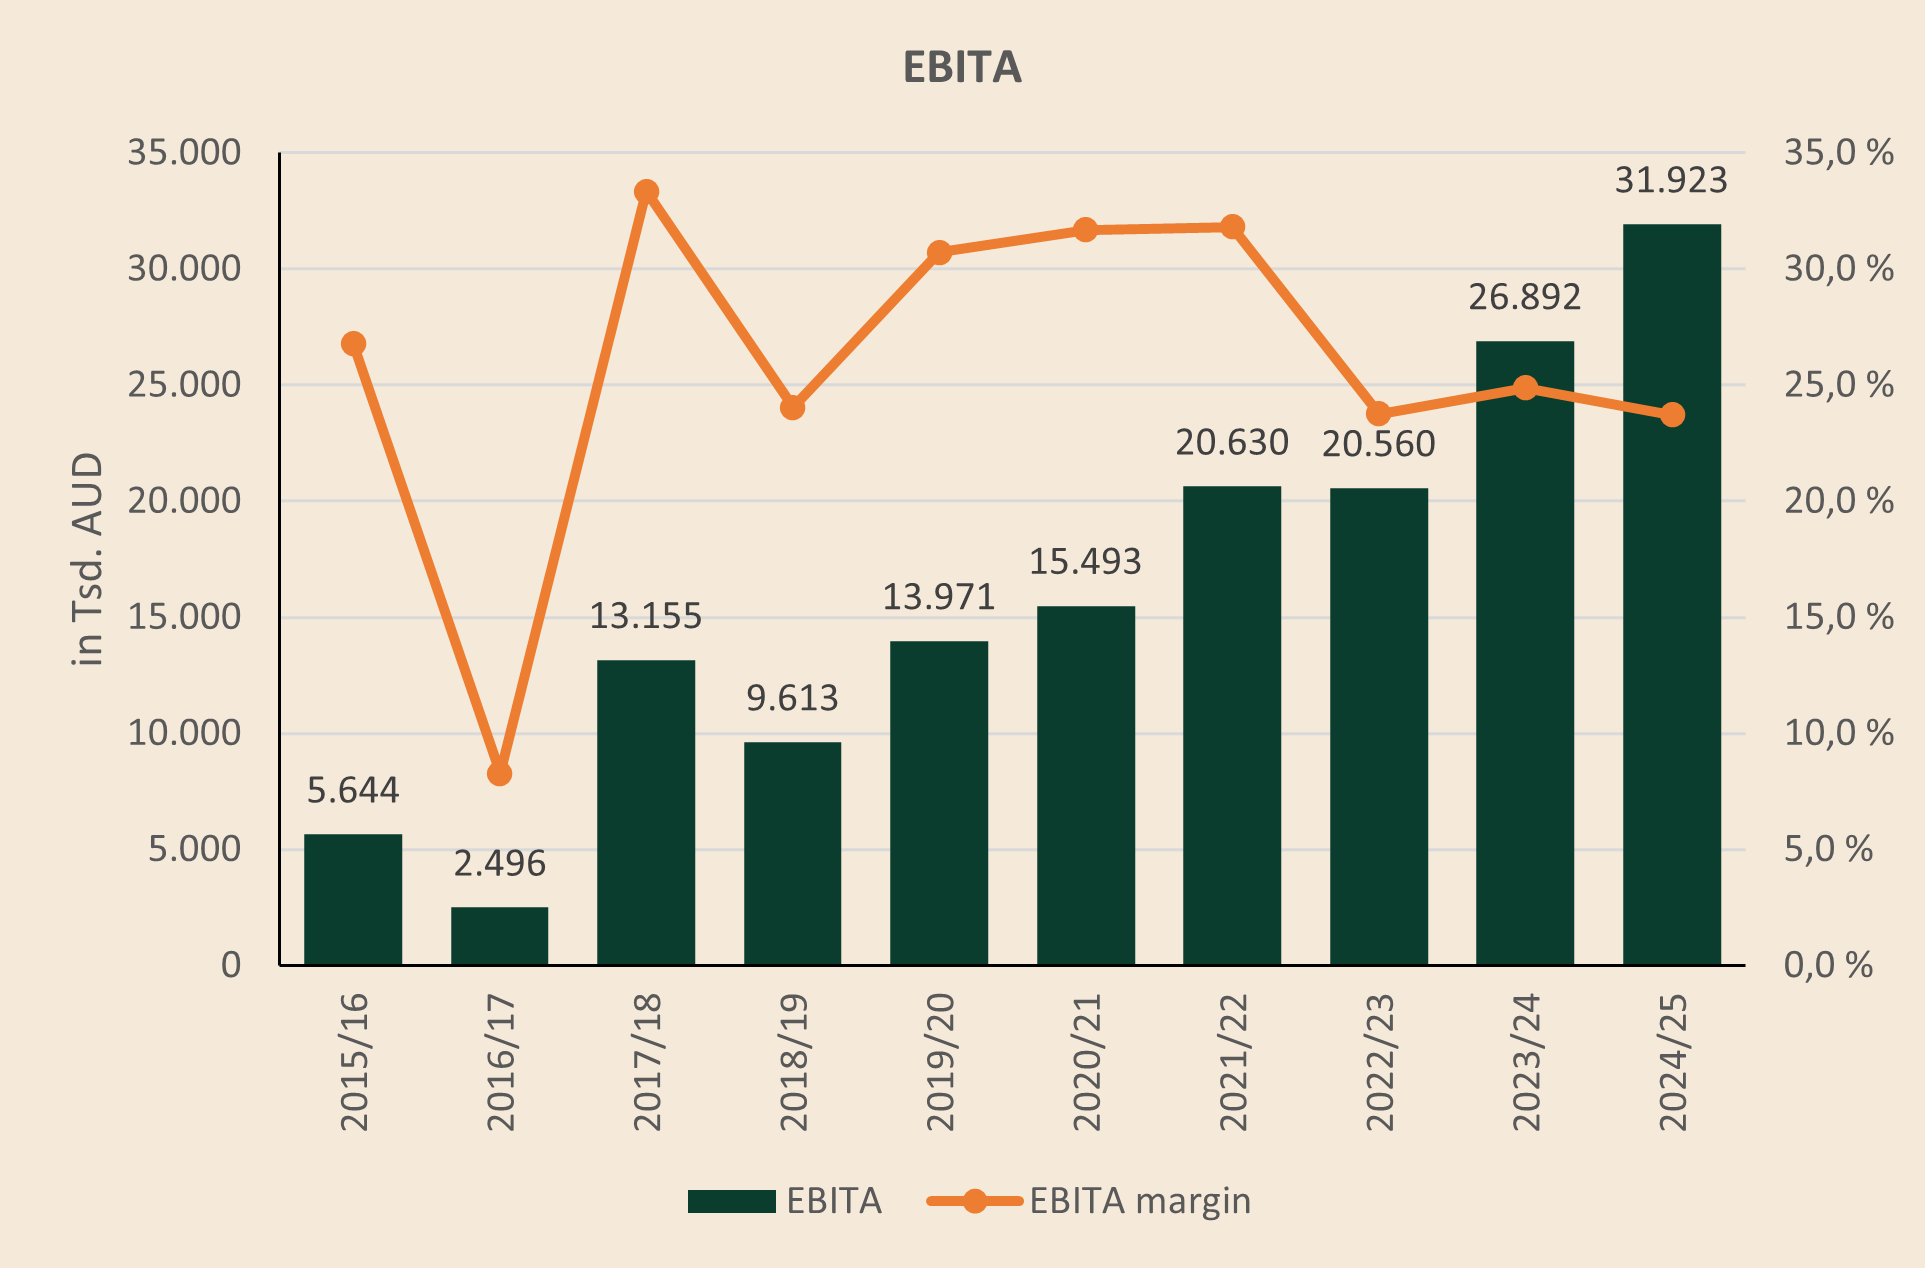
…paired with a nice-looking EBITDA trajectory (even though the EBITDA margin has been meaningfully lower over the last three years).
Add a founder who knows how to sell the story to the market. The investor deck hits all the right keywords:
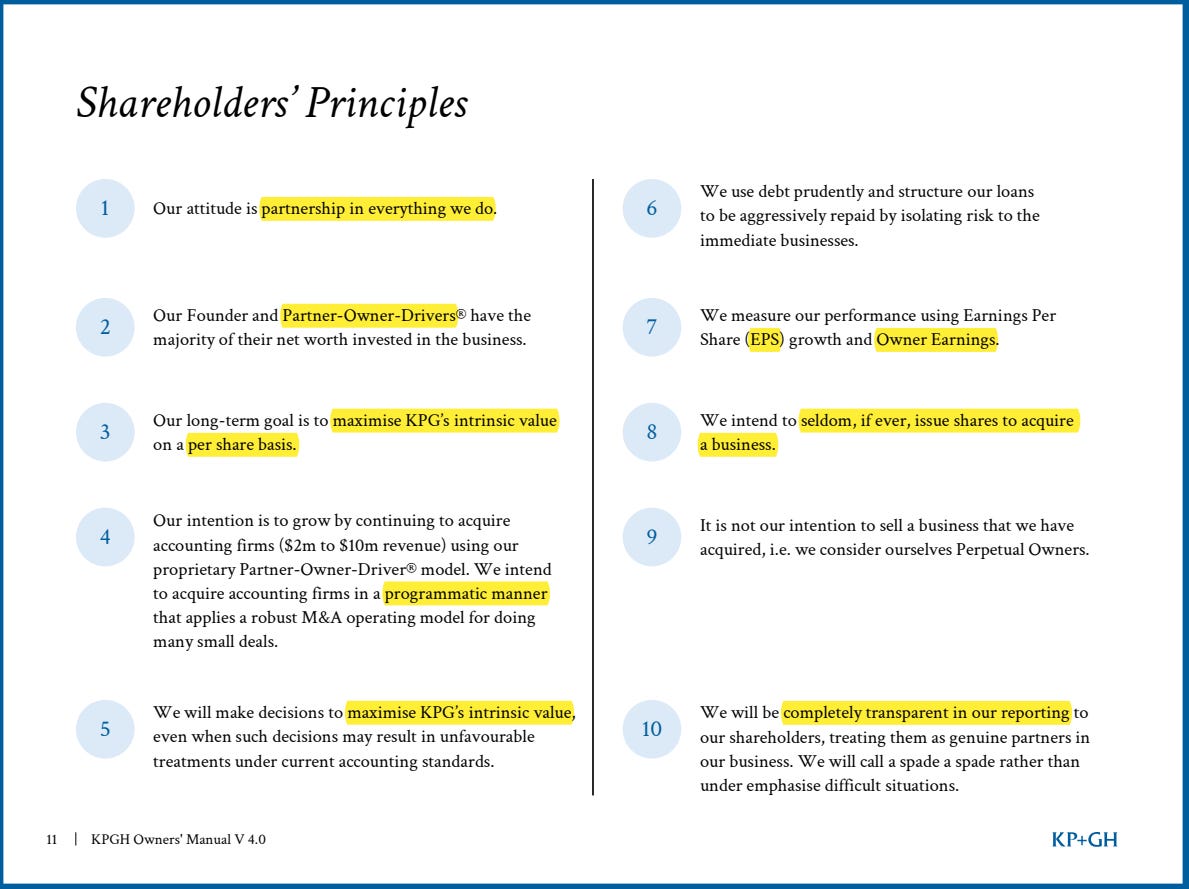
How many IR decks include a “100-bagger checklist”?
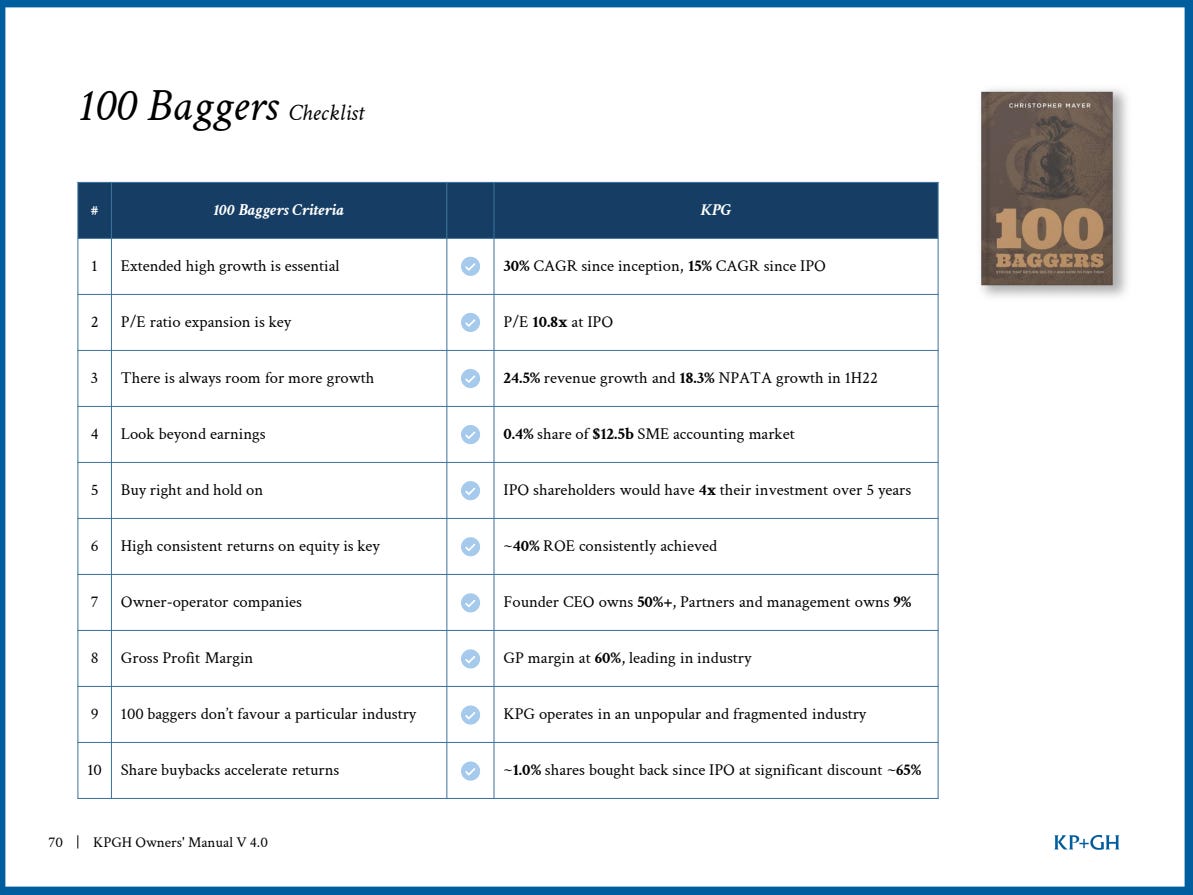
If you stop here, the story sounds close to ideal: recurring revenue + fragmentation + programmatic M&A.
Now comes the uncomfortable part (that I care more about than many others and that keeps me from adding KPG to my portfolio despite the hefty drawdown).
The 51/49 structure
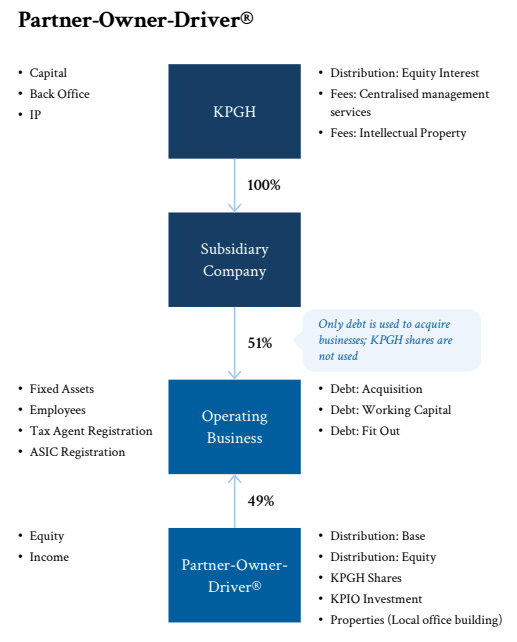
KPG’s twist is its 51/49 structure: it typically acquires only ~51% of the operating firms, while local equity partners keep ~49%. Management presents this as an alternative to traditional “everyone-equal” partnerships—meant to keep operators invested and accountable while still enabling centralized strategy and scale benefits.
But if the pitch is a huge market with a looming succession wave, why do sellers keep nearly half the equity so consistently? I understand minority rollovers—plenty of serial acquirers do that—but they usually buy 75–90% and leave 10–25% with the seller. At KPG, buying ~51% isn’t occasional. It’s the operating model.
KPG calls this the Partner-Owner-Driver® model and describes it as driving long-term strategic alignment and creating a foundation for long-term success and growth for the clients, people, and partners of Kelly Partners.
The listed parent (KPGH) owns 100% of the local holding companies (labeled “Subsidiary Company” in the diagram below). Those entities then acquire a narrow majority stake in the operating businesses that are usually structured as partnerships.
The consolidation optics
When KPG buys ~51% of a firm, it usually controls it—so it consolidates 100% of that firm’s revenue, costs, profit, assets and liabilities into the group financials. That’s normal accounting according to IFRS. But it creates a very abnormal investor trap:
Consolidated numbers can look excellent even when very little incremental shareholder value is created by the structure.
A quick detour into consolidation accounting: a group financial statement treats the parent and its subsidiaries as one economic unit. Once the parent controls a subsidiary (typically via >50% ownership), the subsidiary is fully consolidated. Revenue, costs, and profit show up at 100% in the income statement. The same applies on the balance sheet: assets and liabilities are consolidated at 100%.
The portion of profit and equity attributable to minority shareholders is reported as non-controlling interests (NCI) below net income in the income statement and within equity on the balance sheet.
A simple example illustrates this. Assume the Parent has no operating business of its own and only incurs $5.0 million of interest expense, while the Subsidiary generates all operating profit. Whether the Parent owns 100% or just 51% of the Subsidiary, the consolidated income statement looks identical from revenue down to net income (EAT), because control requires the Subsidiary to be fully consolidated. In both cases, the Group therefore reports $100.0 million of revenue, $40.0 million of EBITDA, and $16.0 million of EAT.
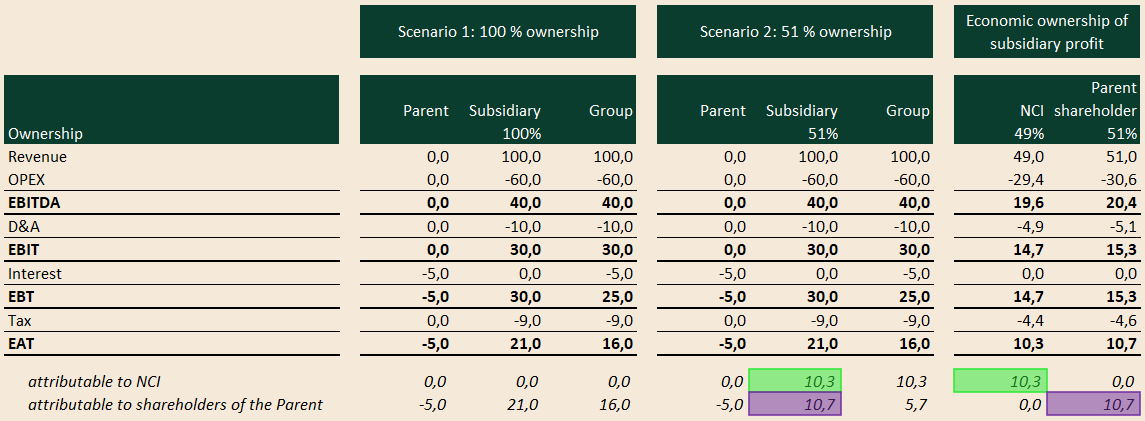
The difference appears only below EAT, where the Subsidiary’s profit is allocated between non-controlling interests and the Parent’s shareholders. In the 51% ownership scenario, $10.3 million of EAT is attributable to minority shareholders, leaving only $5.7 million attributable to the Parent’s shareholders after the Parent’s interest expense. The same economic distinction applies further up the income statement: although the Group reports $40.0 million of consolidated EBITDA, only $20.4 million, or 51%, is economically attributable to the Parent’s shareholders.
Most investors ignore NCI, and for most companies that’s fine because the amounts are immaterial. With KPG, it’s a mistake. If you focus on the fully consolidated numbers and mentally dismiss the minorities, you can end up valuing economics that don’t belong to shareholders of the parent company.
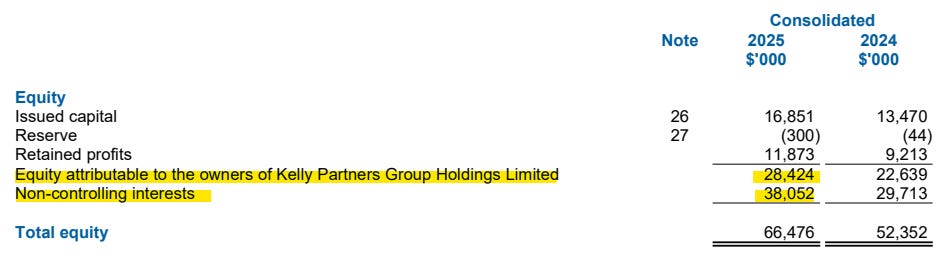
You can see it in the balance sheet: equity attributable to KPGH shareholders is only A$28.4 million, while equity attributable to NCI is A$38.1 million.
The same story shows up at the very bottom of the income statement (a line many investors never reach—they stop at EBITDA). Out of A$16.5 million of profit, only A$3.4 million (!) is attributable to the parent; A$13.0 million goes to NCI.

Read that again: the group reported A$16.4 million of statutory profit, but only A$3.4m was attributable to the parent entity under statutory accounting in FY25.
An EBITDA of ~A$40 million carries a very different “story value” in an investor deck than A$3.4 million of net income attributable to shareholders.
The chart below shows how the group’s profit has been split over time.
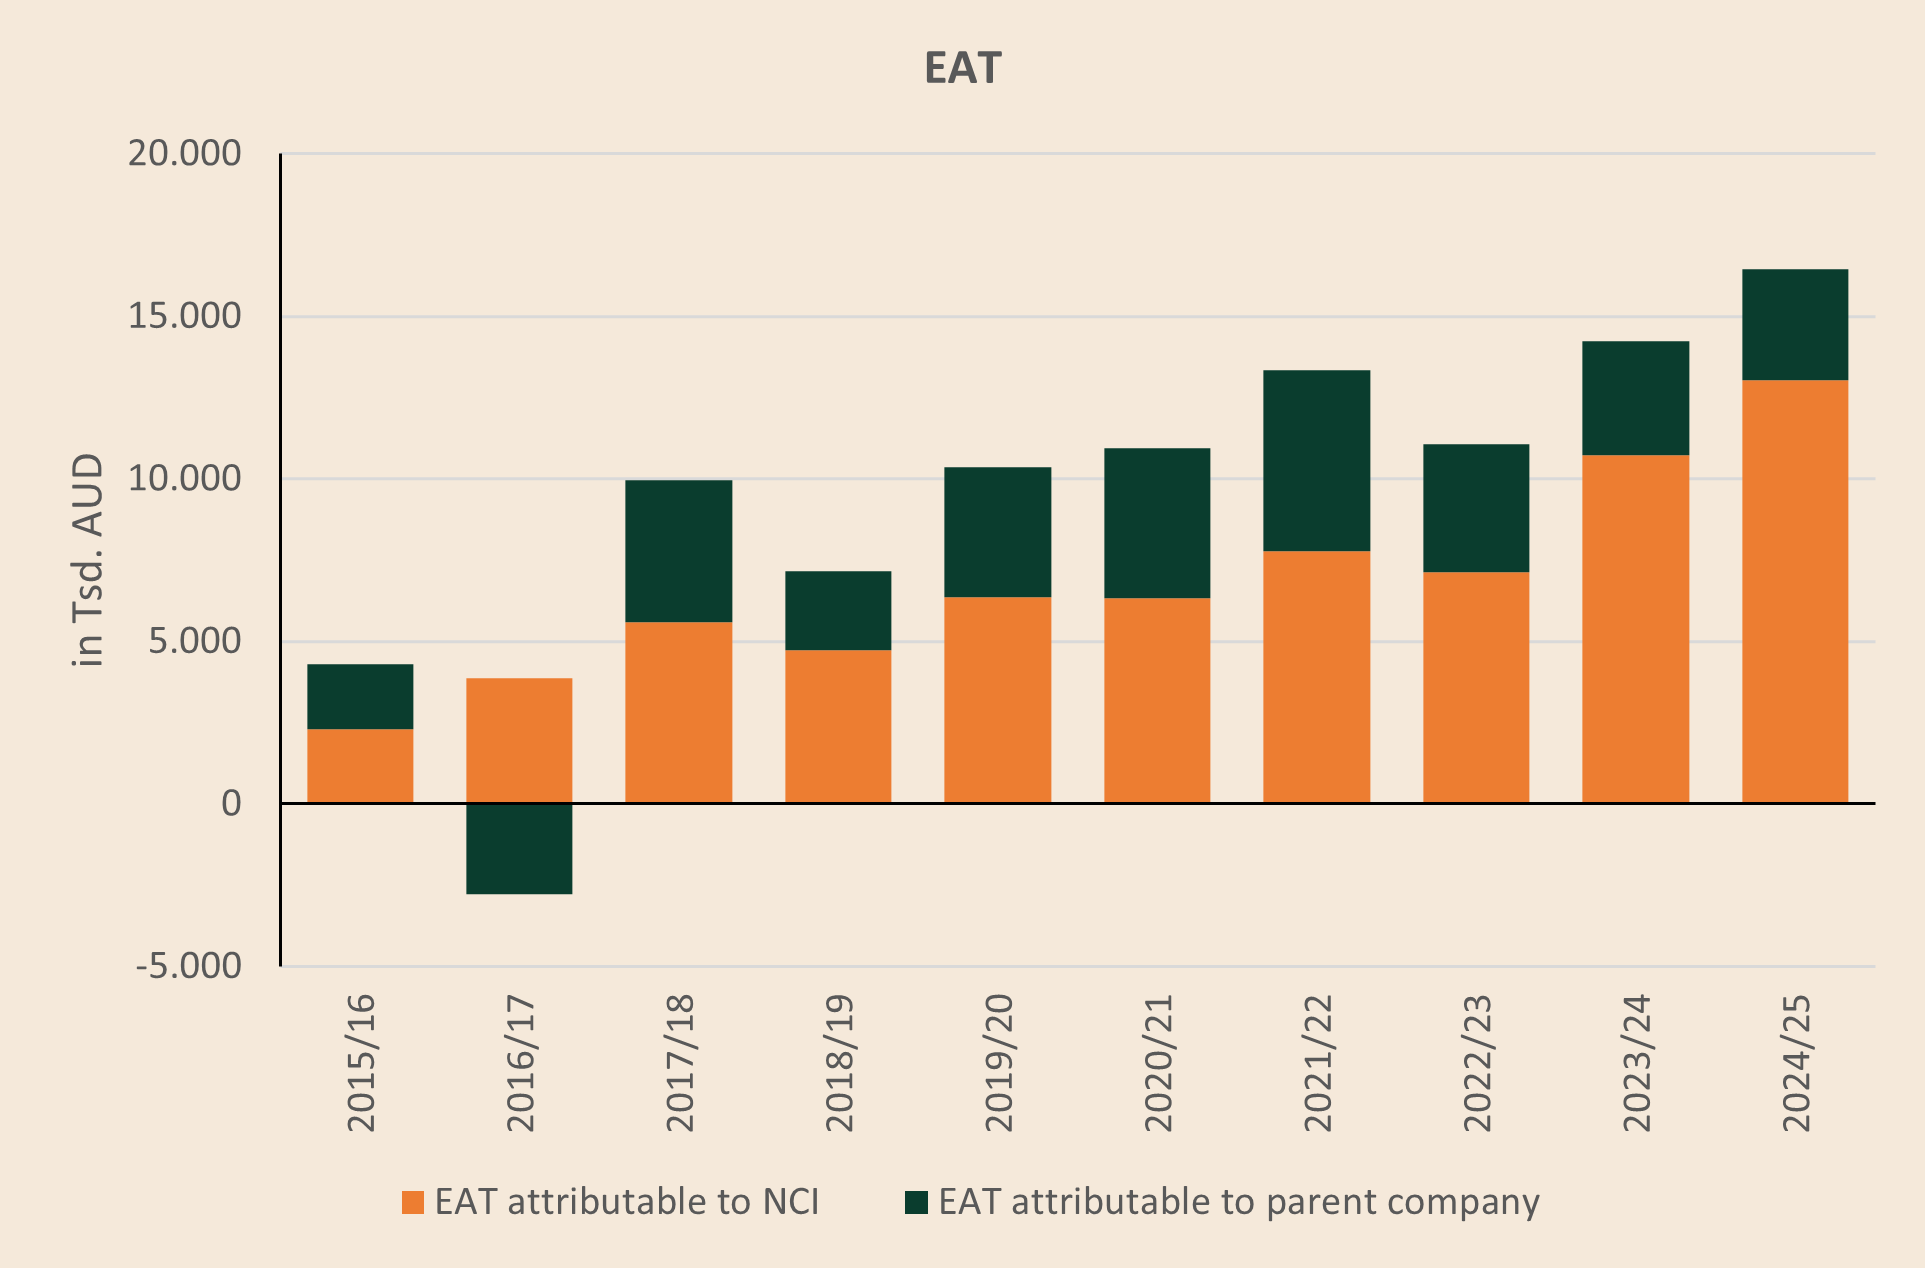
Summing the period FY2015/16 to FY2024/25, KPG reported total group profit of A$99 million. Of that:
Attributable to shareholders: A$31 million (31%)
Attributable to minorities: A$68 million (69%)
That’s substantial.
So why isn’t the split 51/49?
Because the listed parent incurs costs that the partners do not share—such as holding-company expenses, acquisition-related amortization, other purchase-accounting effects, and more. This is the same mechanism illustrated in our hypothetical example: although the minority owners hold only 49% of the subsidiary, 64% of reported Group (!) net income is attributable to NCI, while just 36% accrues to the Parent’s shareholders. The reason is that costs incurred at the Parent level are borne entirely by its shareholders and do not reduce the earnings attributable to NCI. As a result, the NCI share of consolidated net income can be materially higher than the underlying minority ownership percentage, particularly when the Parent’s standalone cost base is significant.
KPG provides the following reconciliation:
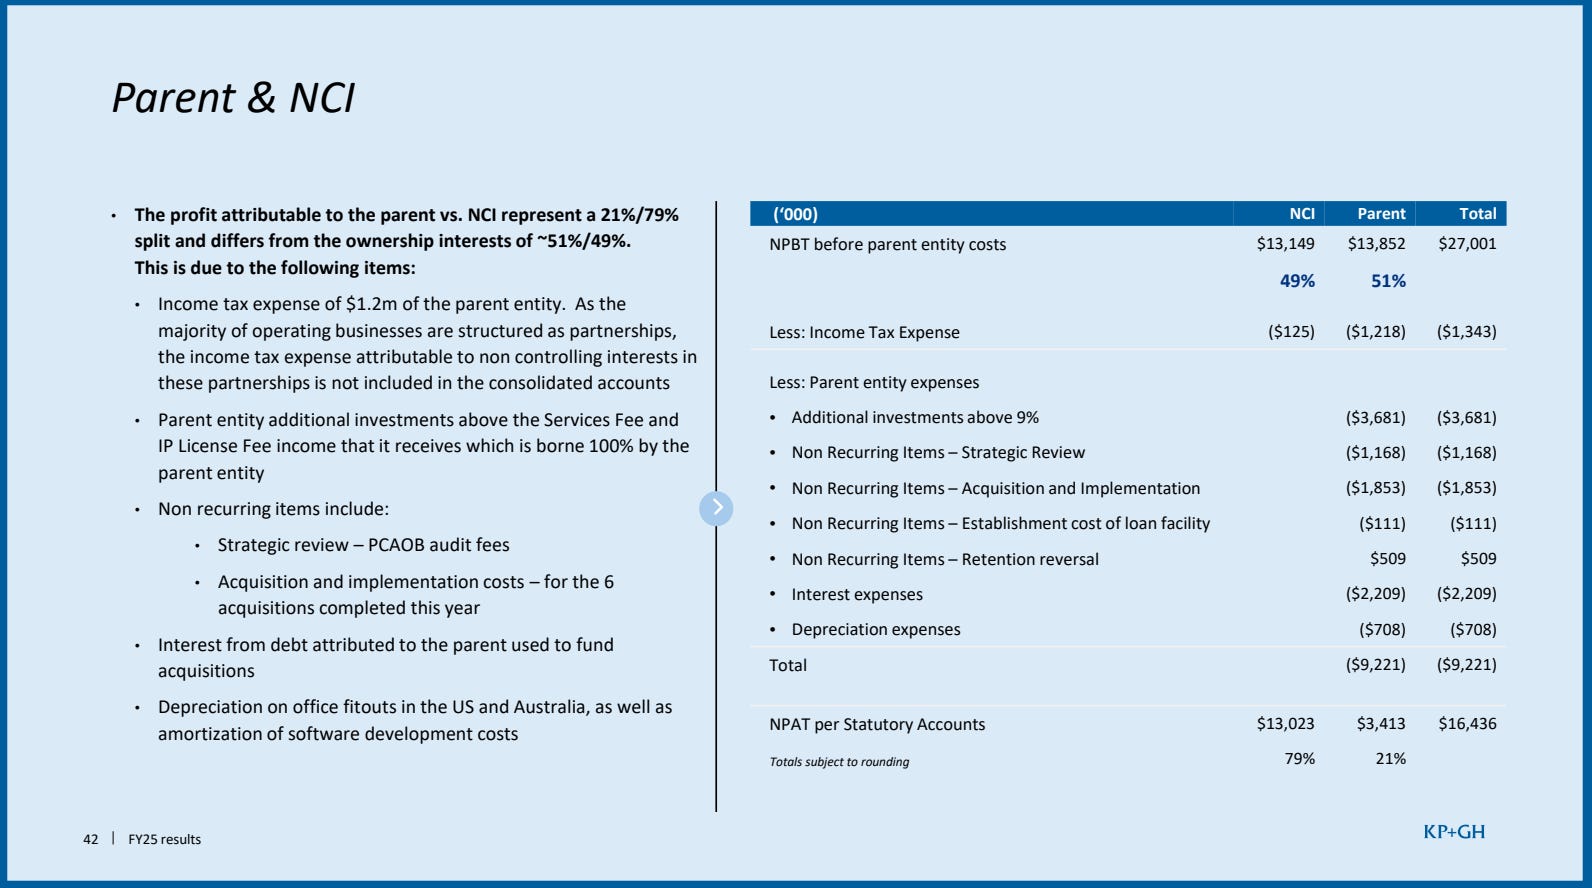
Again: this isn’t fraud. It’s just the deliberate outcome when you buy just 51% in a partnership-style structure. The only mistake is pretending the consolidated numbers describe shareholder economics.
The cash test: where the story gets real
The most important question to ask (and the one almost nobody asks):
How much cash is left for the parent shareholders after the partners get paid?
Unlike profit, cash flow cannot simply be attributed to shareholders and NCI based on their respective ownership percentages. Cash generated by a subsidiary initially remains within that legal entity and is not allocated to either shareholder group until it is distributed. The cash flow statement therefore follows the consolidated-entity perspective and reports the Group’s total cash movements, while only actual transactions with NCI and shareholders—such as dividends or changes in ownership interests—are separately identifiable. Consequently, consolidated operating cash flow may materially overstate the cash that is economically available to the Parent’s shareholders.
If the parent company owns 100% of a subsidiary, the parent can move cash upstream via dividends or cash pooling without any real friction. Those intra-group movements disappear in consolidated financial statements.
Once meaningful minority owners exist, that changes. Cash pooling can still happen, but it creates real intercompany balances that have to be repaid; the cash is not simply “free.” Dividends can be paid, but then minorities participate too.
For FY2024/25, KPG reports operating cash flow of A$31.3 million. Against EBITDA of A$39.3 million, that looks like normal 80% cash conversion.
But then you hit the line that matters:
In financing cash flow, KPG reports “Distributions paid to non-controlling interests.” In FY2024/25, that was A$19.1 million (!)—more than half of operating cash flow.
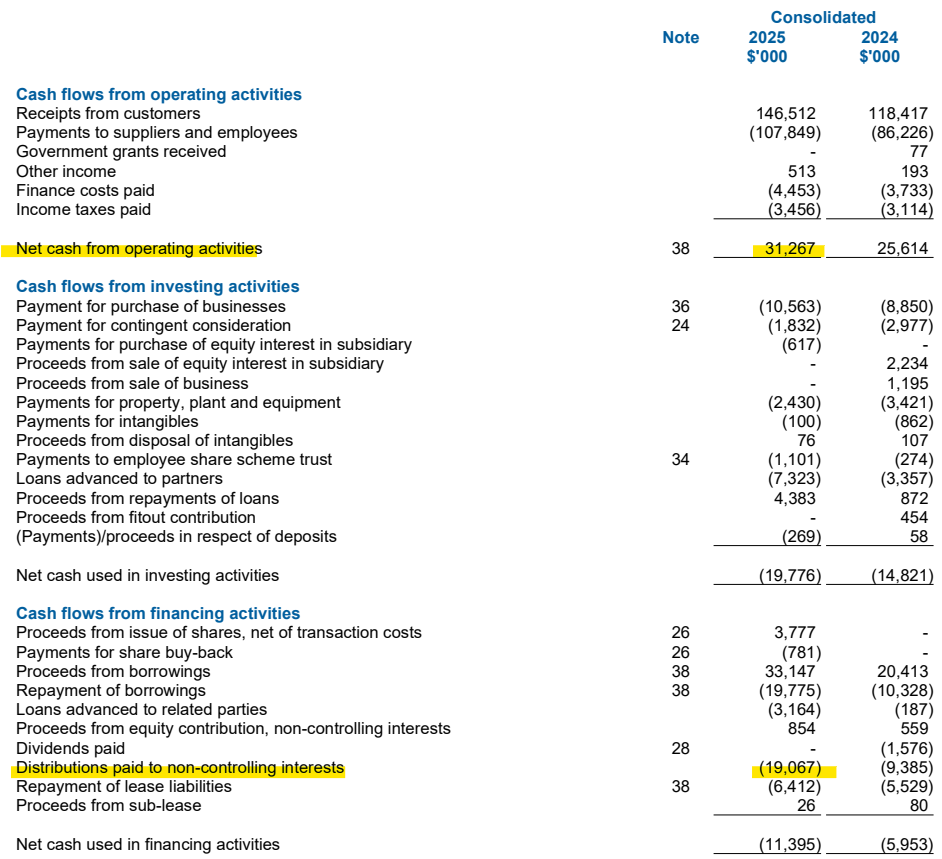
These are partnership distributions, comparable to dividend payments from the subsidiary to its owners (e.g. the parent company and minority shareholders). The parent company also receives its own share internally, but you don’t see that as an external outflow, as intra-group transactions are eliminated in consolidated numbers. The cash paid to minority owners leaves the group, which is why it shows up in financing cash flow. Either way, it’s obviously not cash that belongs to public shareholders—and ignoring it is costly.
Owners’ Earnings
KPG highlights a metric it calls “Owners’ Earnings.” It starts with operating cash flow and subtracts lease repayments and maintenance capex:
Step one: subtract “repayment of lease liabilities” of A$6.4m. Under IFRS 16 (AASB 16 in Australia), office leases create a right-of-use asset and a lease liability. The right-of-use asset is depreciated (lifting EBITDA and depreciation), while cash lease payments are split between interest expense and principal repayment. That principal repayment is the A$6.4m reported in financing cashflow. Before IFRS 16, rent was simply an operating expense. Without this adjustment, operating cash flow can look optically higher for lease-heavy businesses. If you don’t correct for it, operating cashflow is overstated (I have written about this topic here).
Step two: subtract maintenance capex. IFRS doesn’t define this line item, so it inevitably involves management judgment (not necessarily good or bad—just something to keep in mind).
On that basis, KPG’s “Owners’ Earnings” chart implies roughly ~24% annual growth:
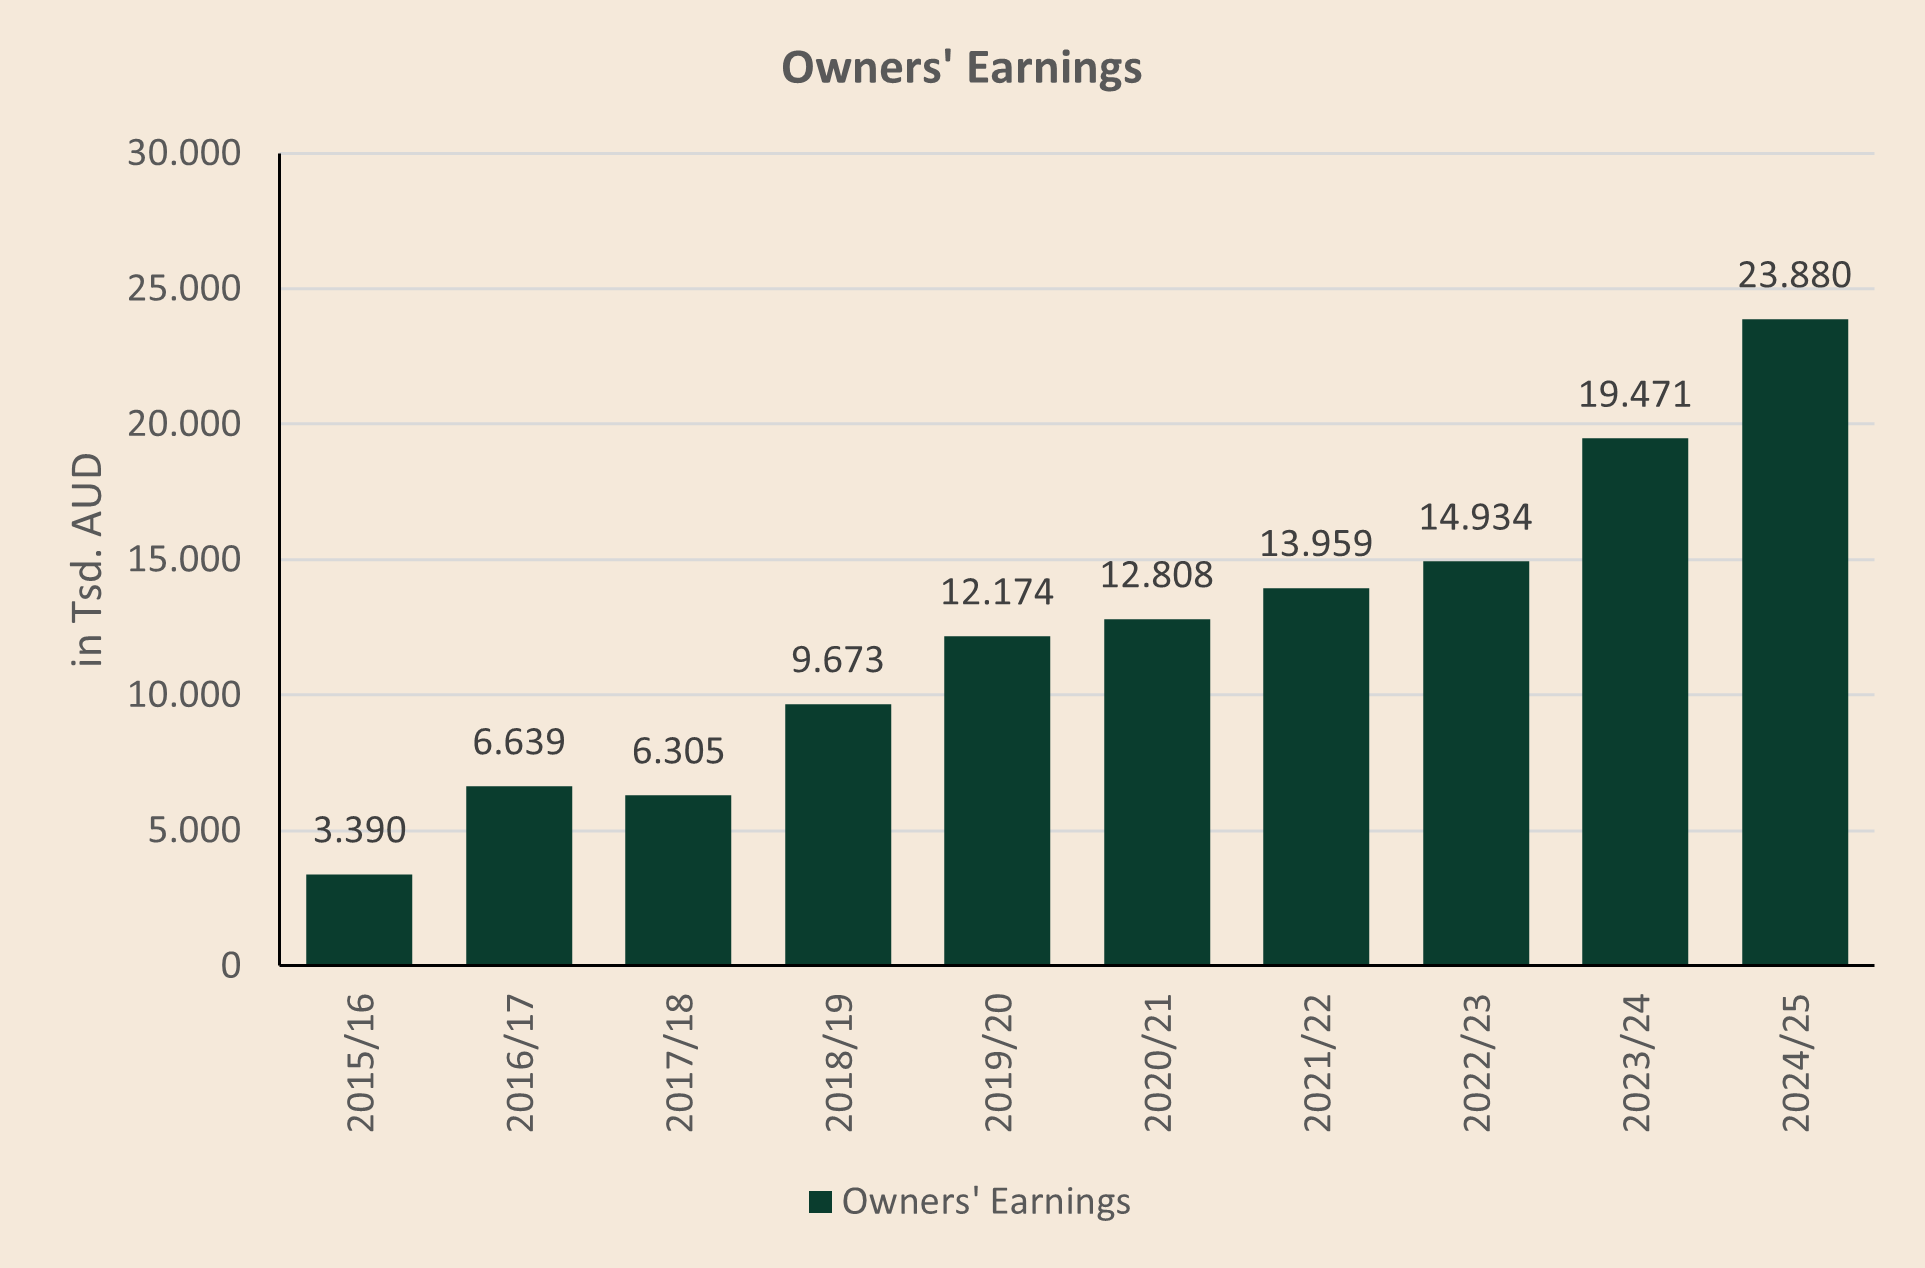
But the ~A$24 million reported for FY25 are not, as the label “Owners’ Earnings” might suggest, cash that belongs to KPGH shareholders. A cleaner shareholder-level view subtracts the distributions to NCI. The chart then looks like this:
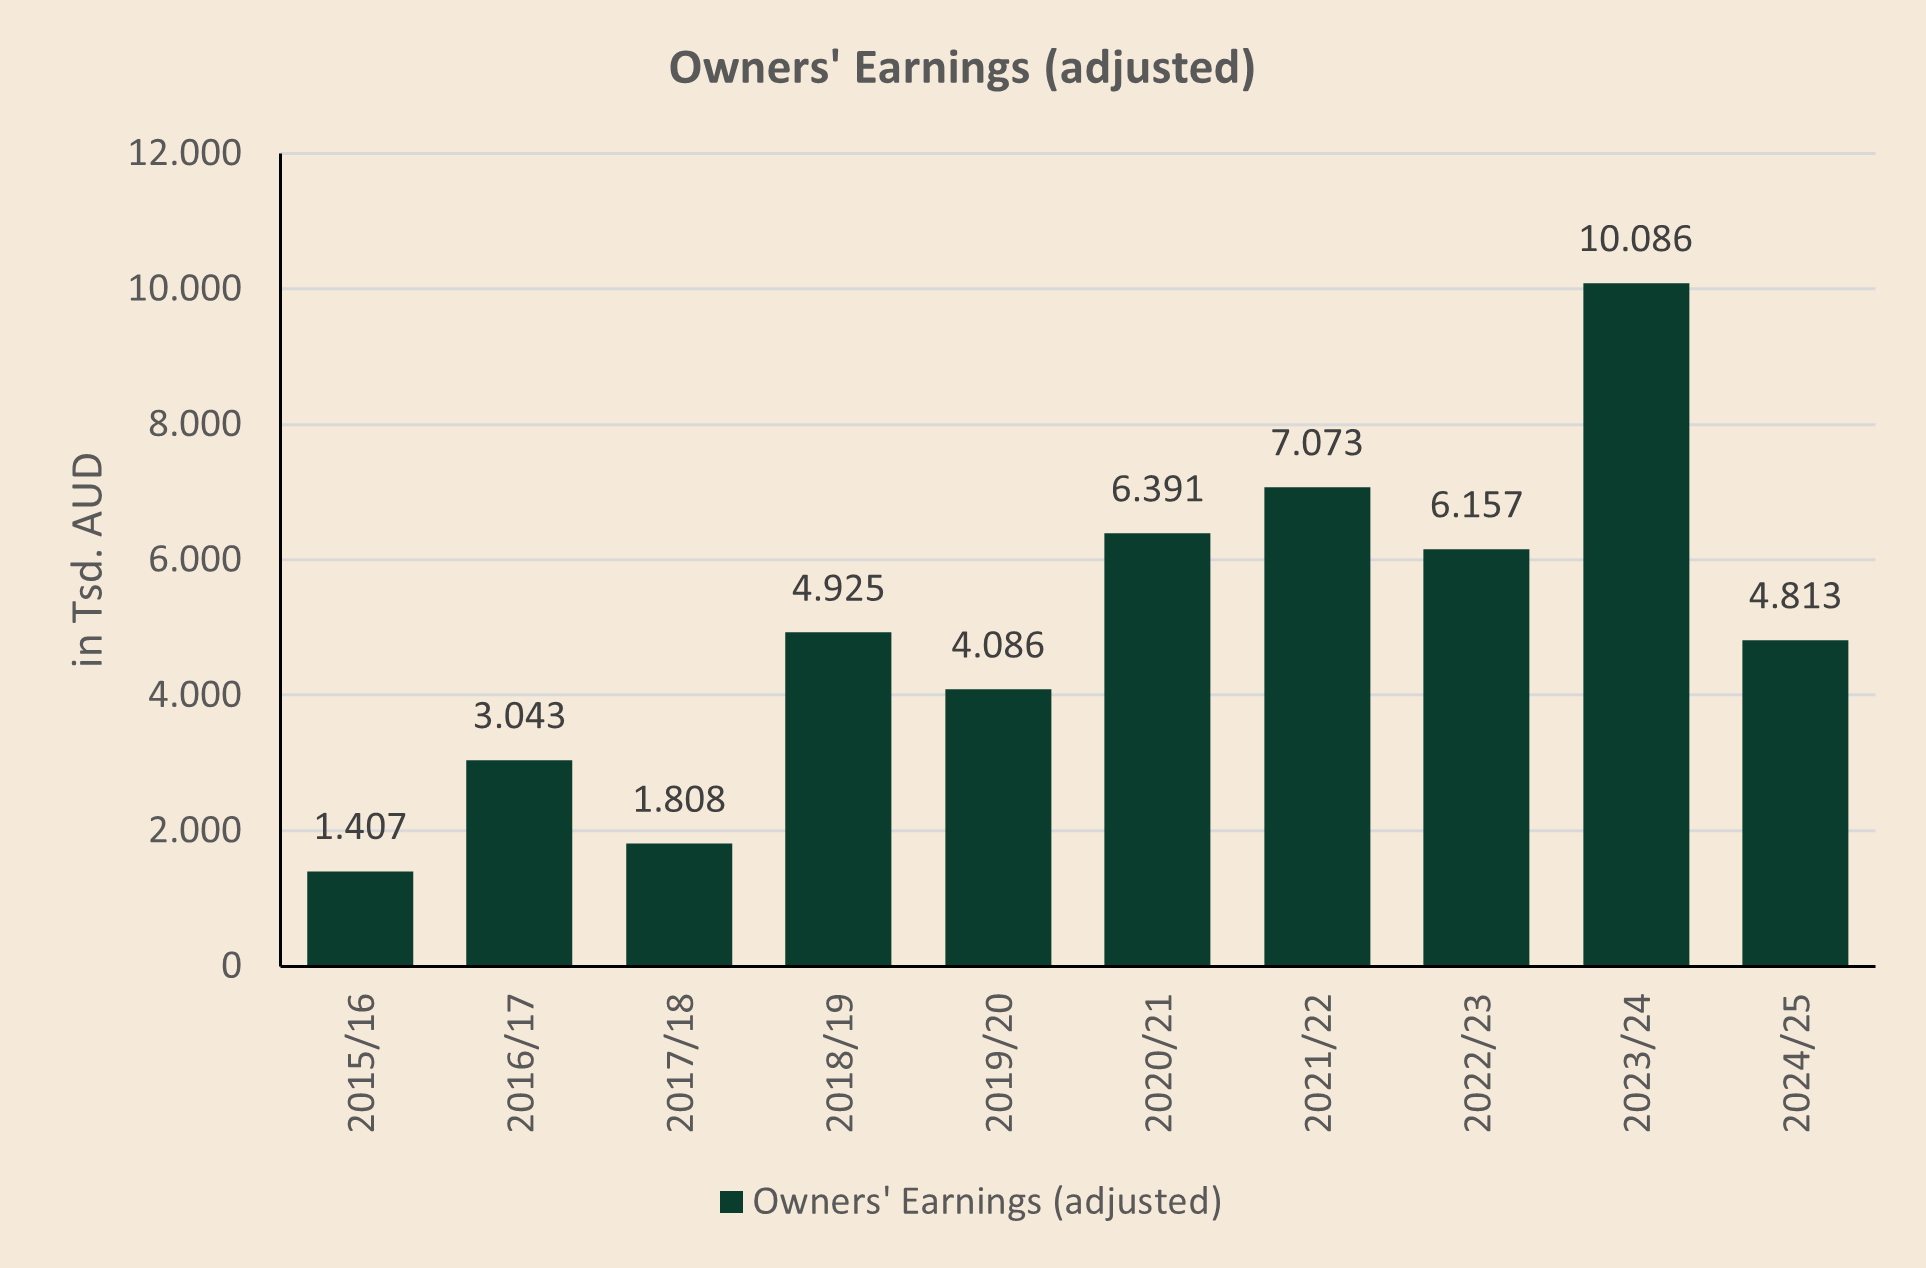
There’s still a positive trend—but the owners’ earnings attributable to shareholders are materially lower than what KPG discloses for the group. Far less impressive than growth in reported EBITDA and in Owners’ Earnings.
KPG says it aims to communicate transparently. Still, it’s hard to shake the feeling that this topic is kept in the background. In June 2025, I emailed Brett Kelly asking why distributions to NCI are ignored in the “Owners’ Earnings” narrative and equity story. After a couple of follow-ups, I still haven’t received a response.
To be fair, KPG does calculate Owners’ Earnings for the parent company somewhere in its investor presentations (hidden). It’s close to my estimate, but not identical. The problem is that the bridge isn’t explained anywhere, and the parent-level number isn’t put at the center of communication, although this metric reflects the true economics attributable to shareholders much better. The communication remains on the group-level optics, which is misleading.
The chart below shows how KPG has allocated capital over time, including distributions to NCI, which are too material to ignore.
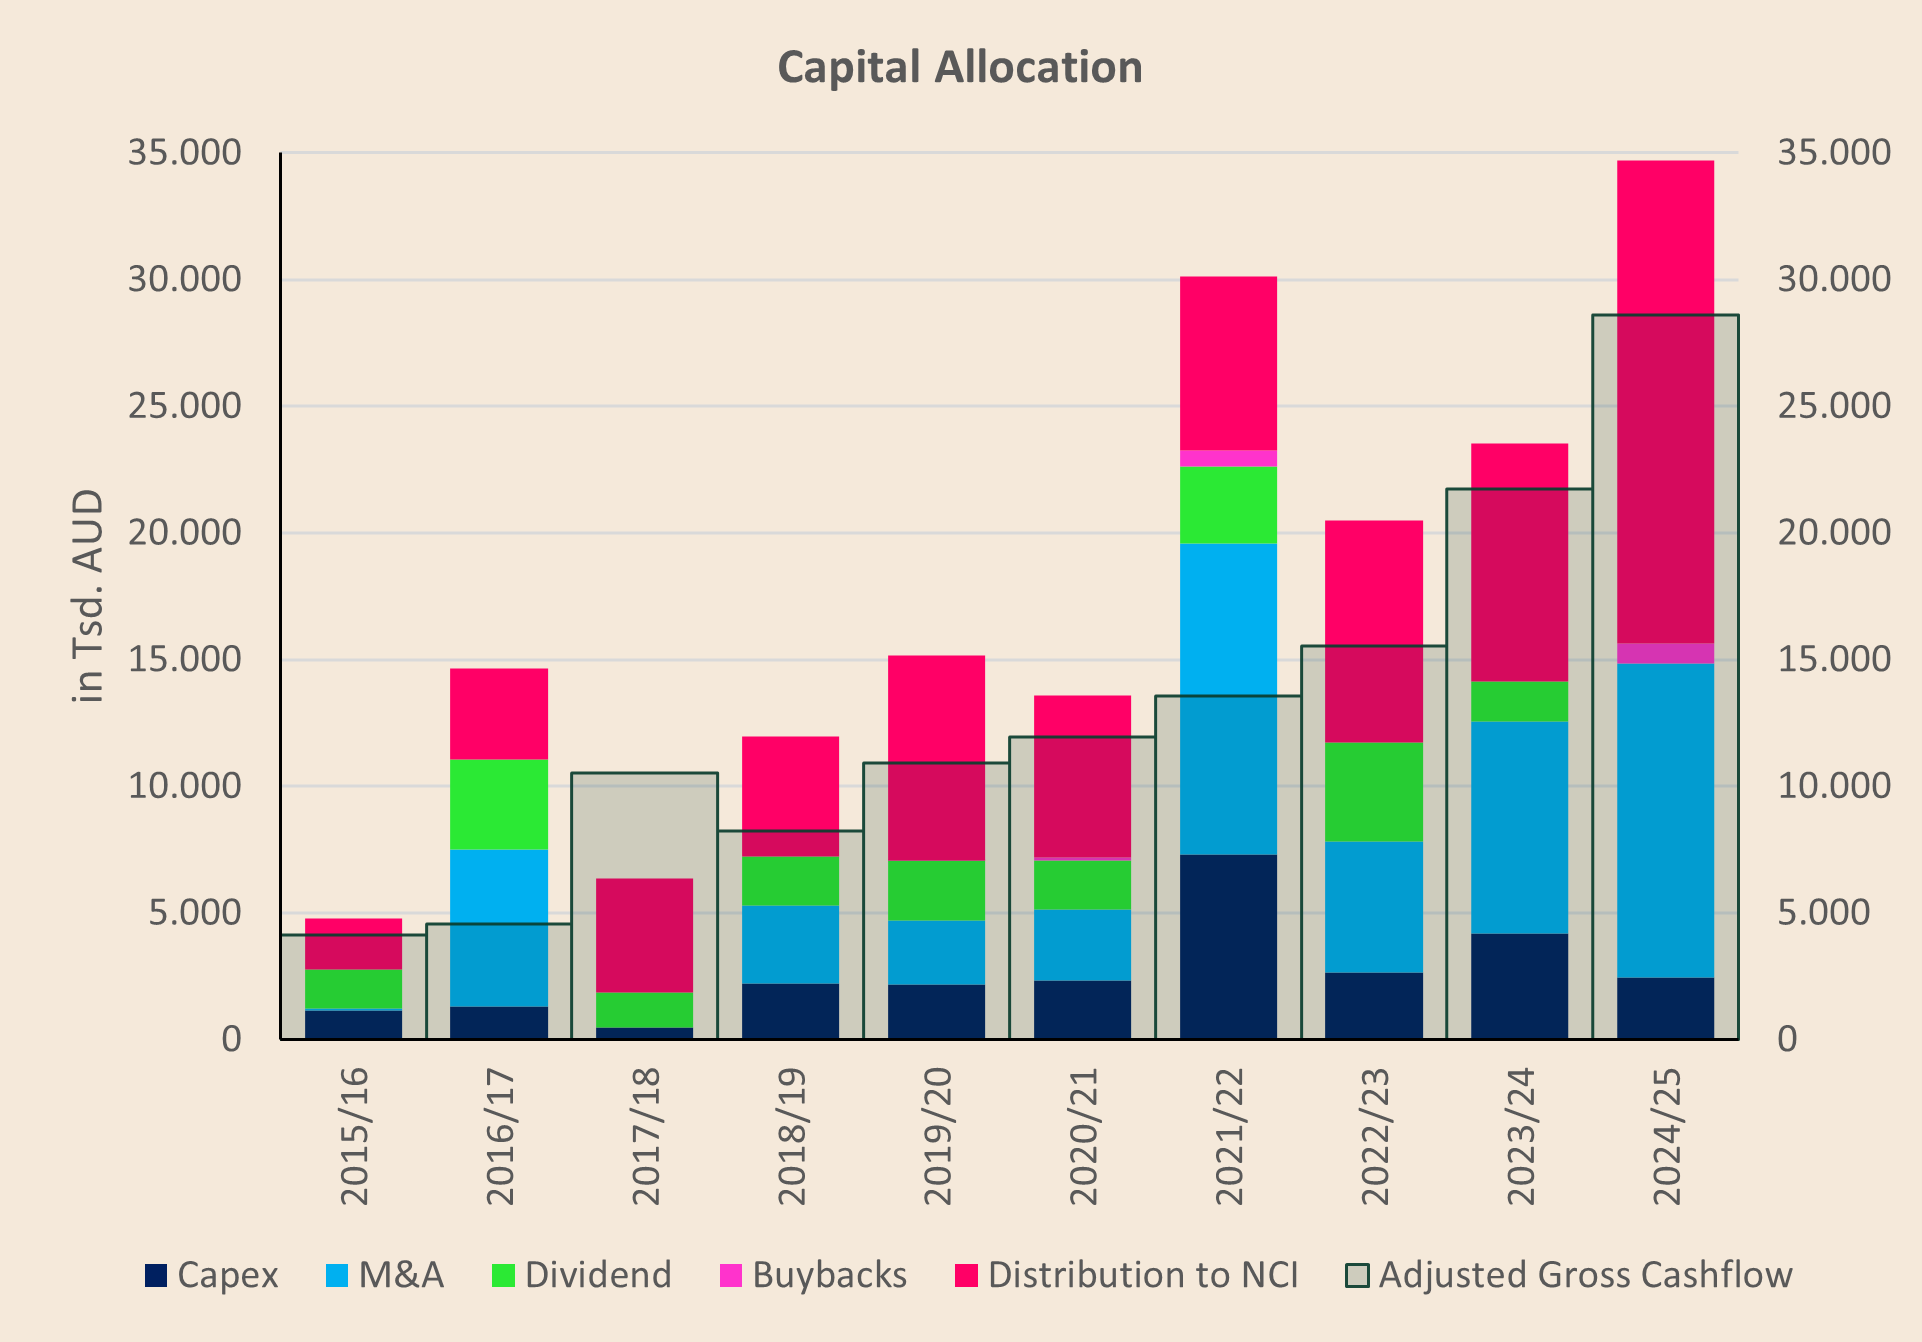
From FY2023/24 to FY2024/25,
EBITDA increased by $5.8 million, from $33.5 million to $39.3 million,
while adjusted operating cash flow—defined as operating cash flow less IFRS 16 lease repayments—rose by $4.8 million, from $20.1 million to $24.9 million.
However, distributions paid to NCI increased even more sharply, by $9.7 million, from $9.4 million to $19.1 million.
As a result, the owner earnings attributable to KPG’s shareholders declined from $10.7 million to just $5.8 million despite the improvement in reported EBITDA and cash generation.
Leverage
As a result of the inflated revenue and EBITDA lines, the headline net debt / EBITDA is understated. KPG reports gearing (Net Debt / Underlying EBITDA) of 1.42x for FY2024/25. It looks conservative, but does it reflect the underlying economics appropriately?
Remember: KPG’s fully consolidated EBITDA includes subsidiaries it owns only ~51% of. But most of the debt sits at the parent level. Putting parent net debt against fully consolidated EBITDA—of which shareholders effectively own only a bit more than half—can paint a dangerously rosy picture.
I’d make a few adjustments:
Net debt: KPG excludes roughly A$7 million of contingent consideration. I would typically include it when calculating net debt.
EBITDA: I would haircut EBITDA by 50% as a blunt proxy for the portion economically attributable to minorities.
Leases: KPG’s leverage framing also downplays IFRS 16. Economically, offices aren’t free. You should count leases once—either include lease liabilities in net debt or adjust EBITDA to reflect rent, as long as leasing is not immaterial. I include lease liabilities in net debt.
On my net debt number alone, leverage moves to ~2.5x. If you then use only the portion of EBITDA that is actually attributable to the parent (and therefore to debt repayment), leverage rises to ~5.0x, vs. ~1.4x disclosed by KPG.
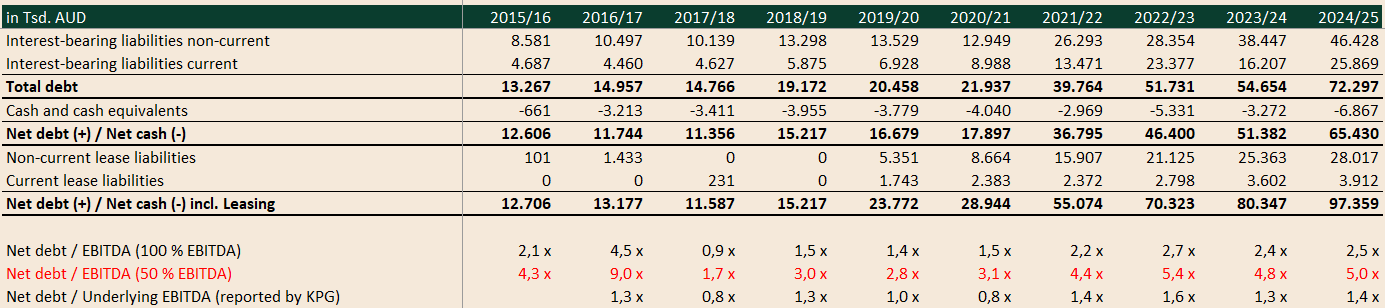
Excluding lease liabilities, net debt still comes in at ~A$65 million. Comparing that number with the ~A$5-10 million Owners’ Earnings attributable to the parent, it doesn’t look that conservative anymore. It would take 5-10 years of cashflow available to shareholders to pay down net debt.
Conclusion
Stepping back, here’s how I think the model really works: KPG typically buys just 51%. That gives it control—and with it, full consolidation—so the reported revenue and EBITDA lines look great, and the upfront cash outlay per deal stays relatively low (vs acquiring 100% right away). The trade-off is that a meaningful share of the economics never belongs to the parent in the first place. It shows up later as a structural cash outflow in the financing section—“distributions to NCI”—right where most investors don’t bother to look. These distributions to NCI will never show up in FCF, although it’s a significant “expense” for shareholders of the parent company KPGH.
This structure makes the company appear economically larger than it really is—and that can support a higher valuation if you just look at EV/EBITDA-multiples. The obvious question is: how many analysts and investors actually value the minority interests properly and include them in enterprise value or cut EBITDA in half to reflect only the portion that is attributable to shareholders of the parent company?
It also supports a low-looking leverage ratio that can be used to fund more acquisitions. The group keeps adding consolidated EBITDA—without generating much free cash flow for public shareholders—because distributions to NCI sit in financing cash flow and quietly drain the pool. Those payments are a structural outflow. They are not discretionary capital allocation.
With a market cap of roughly A$175m and net debt of about A$97m (including earn-outs and lease liabilities), enterprise value is around A$272m. Using my adjusted owners’ earnings attributable to shareholders of A$4.8m, and adding back A$6.5m of interest expense (which reduces operating cash flow), I get roughly A$11.3m of “adjusted owners’ earnings before interest.” That’s an owners’ earnings yield of about 4.2% on EV—even after a ~60% drawdown in the share price.
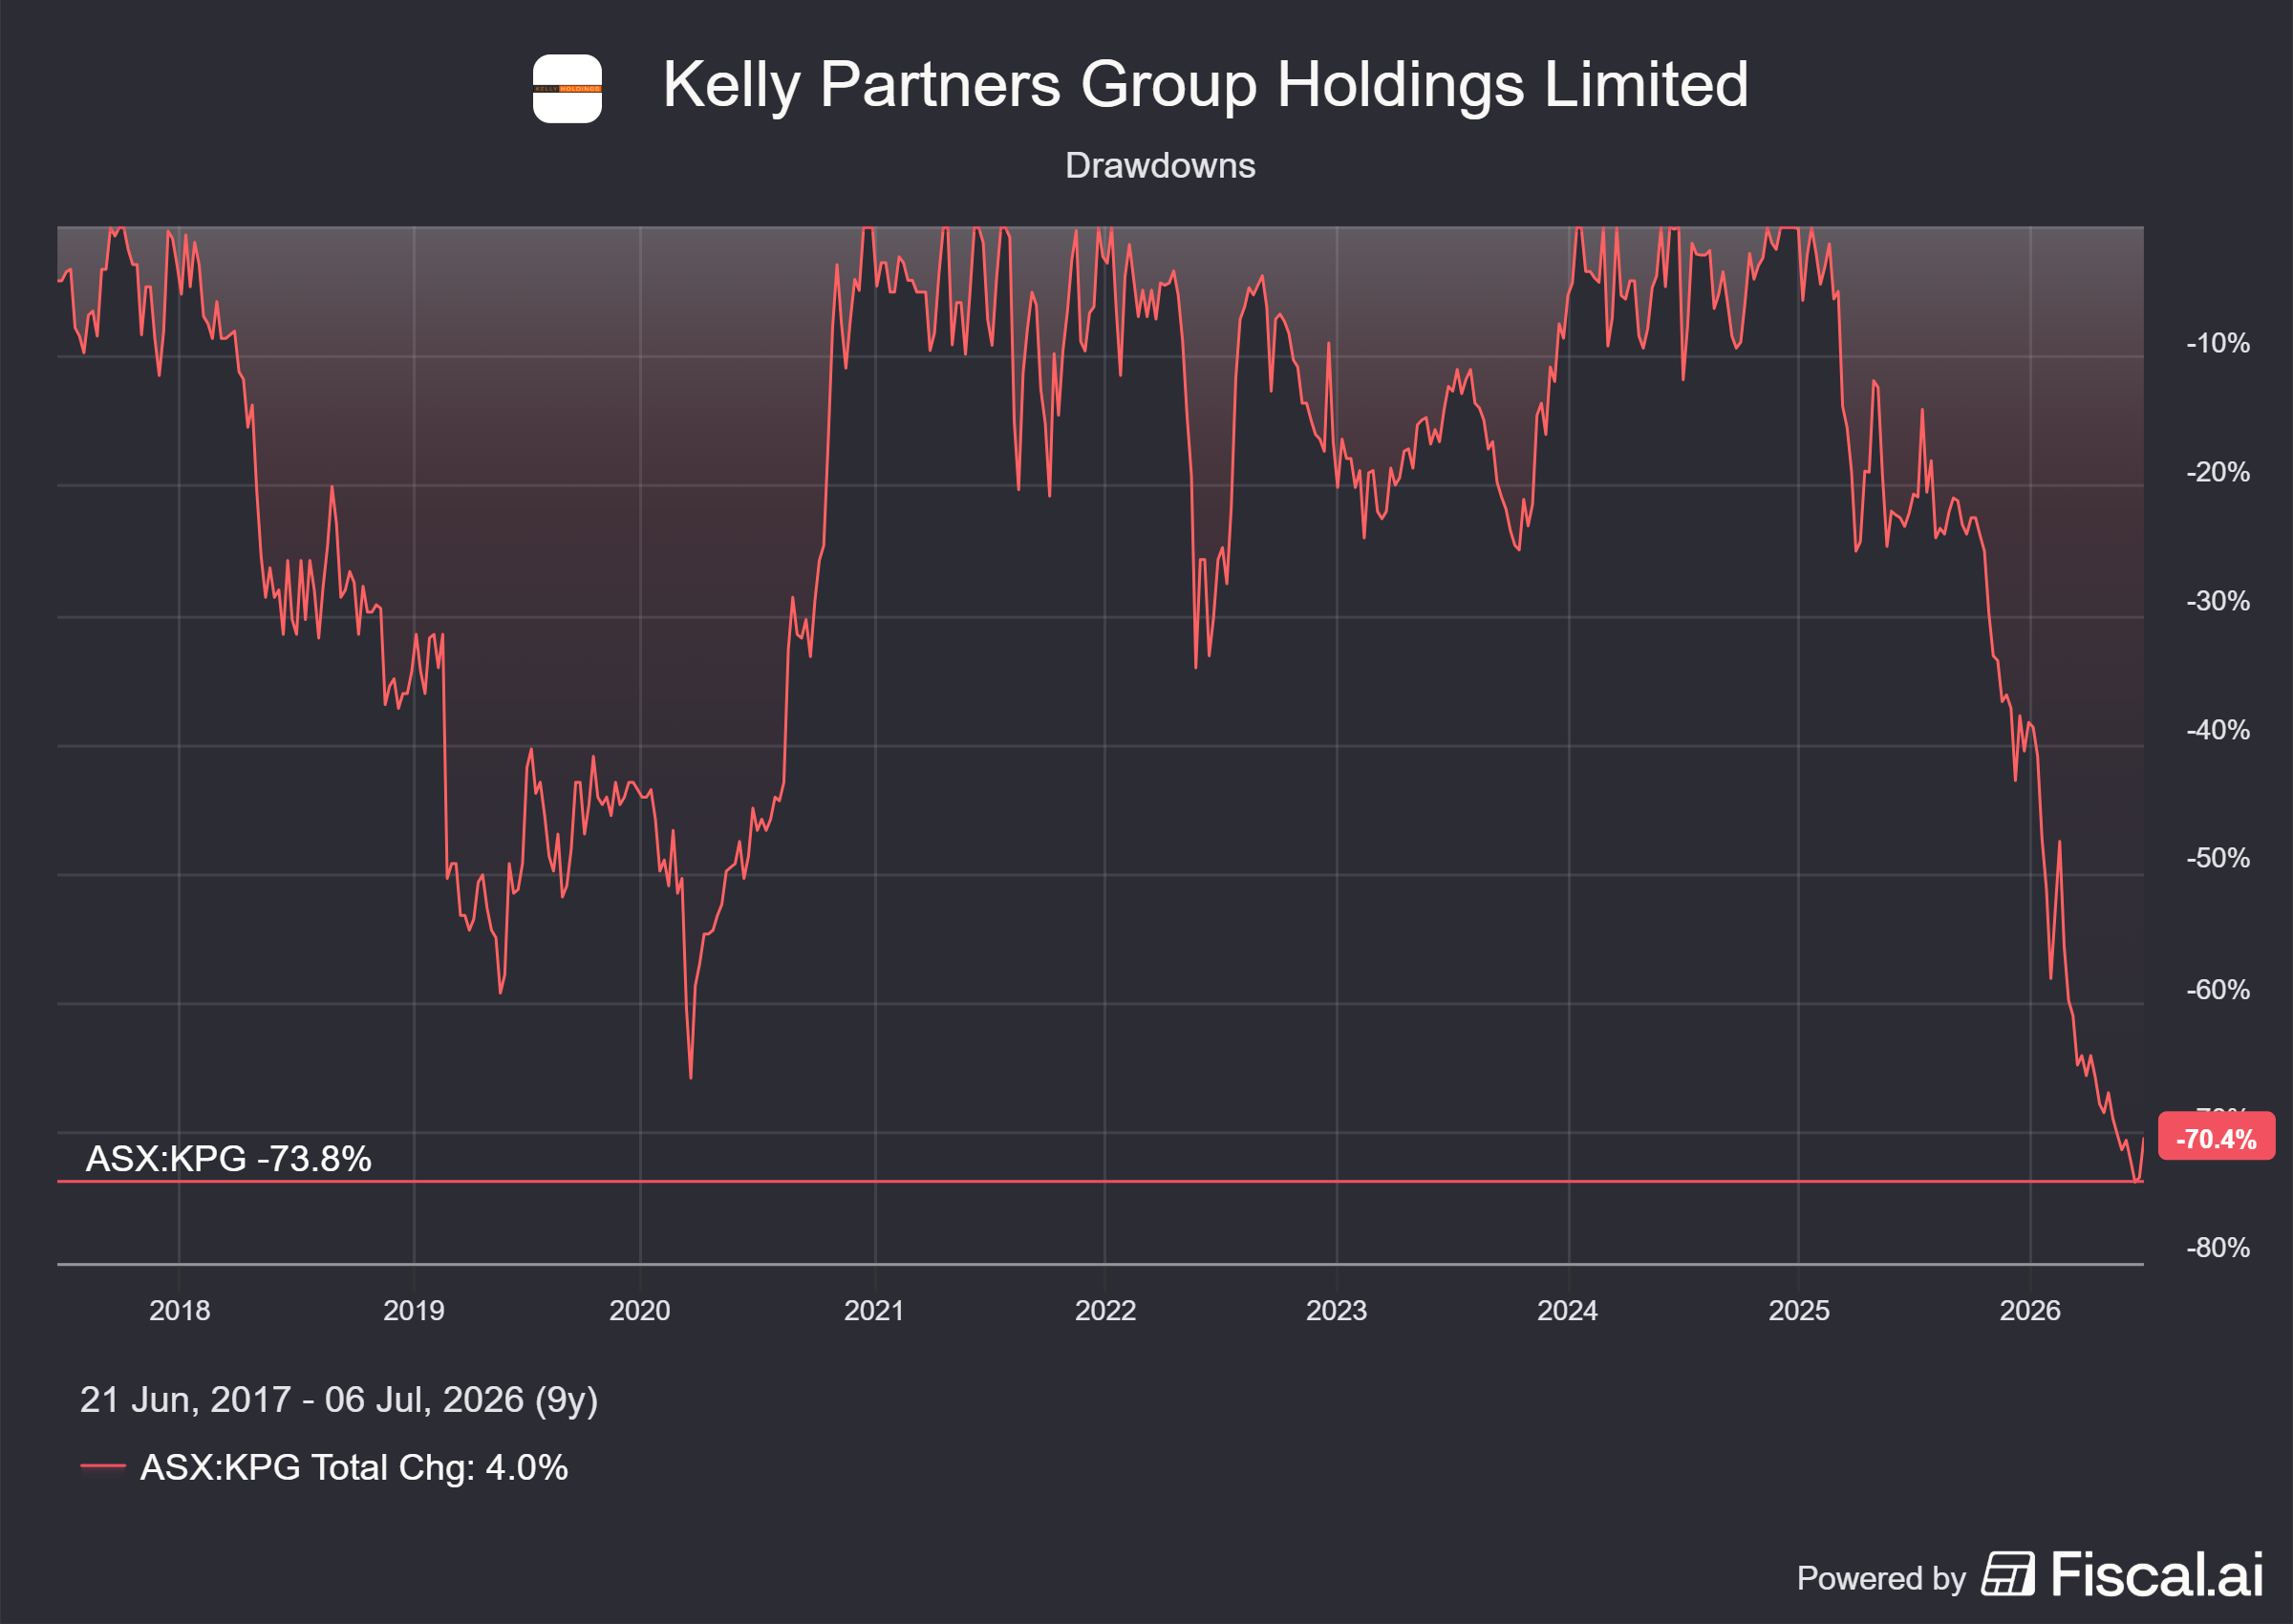
For me, KPGH is not investable, and the recent developments surrounding Brett Kelly have only reinforced my critical assessment—although I do not intend to discuss them further here.
I really appreciate the thoughtful discussion and input from the Substack community 🙏 The different perspectives, challenges, and follow-up questions are exactly what make publishing here so valuable!
I do not want to imply any deliberate deception, but the complexity of the structure can easily create a misleading impression for retail investors without a strong accounting background, particularly when consolidated group metrics are emphasized without equally highlighting the portion attributable to NCI! The same applies to the balance sheet: when debt is assessed against the cash flow actually attributable to KPG shareholders rather than consolidated EBITDA, the business is economically much more leveraged than it may appear at first glance.